
Perigon publishes a Low-Carbon Transition Index. Fourteen indicators, from energy generation to carbon pricing, each scored against two pathways:
1. the pace the world is on under current policy, and
2. the pace it needs to be on for Net Zero.
Andrew Hutchison, our Head of Climate and Transition, and Emma Walford, our CEO, own the model behind it.
For about a week before publication, the scorecard said the transition scored 56.1 against current policy and 44.0 against Net Zero.
The real numbers were 65.2 and 58.1.
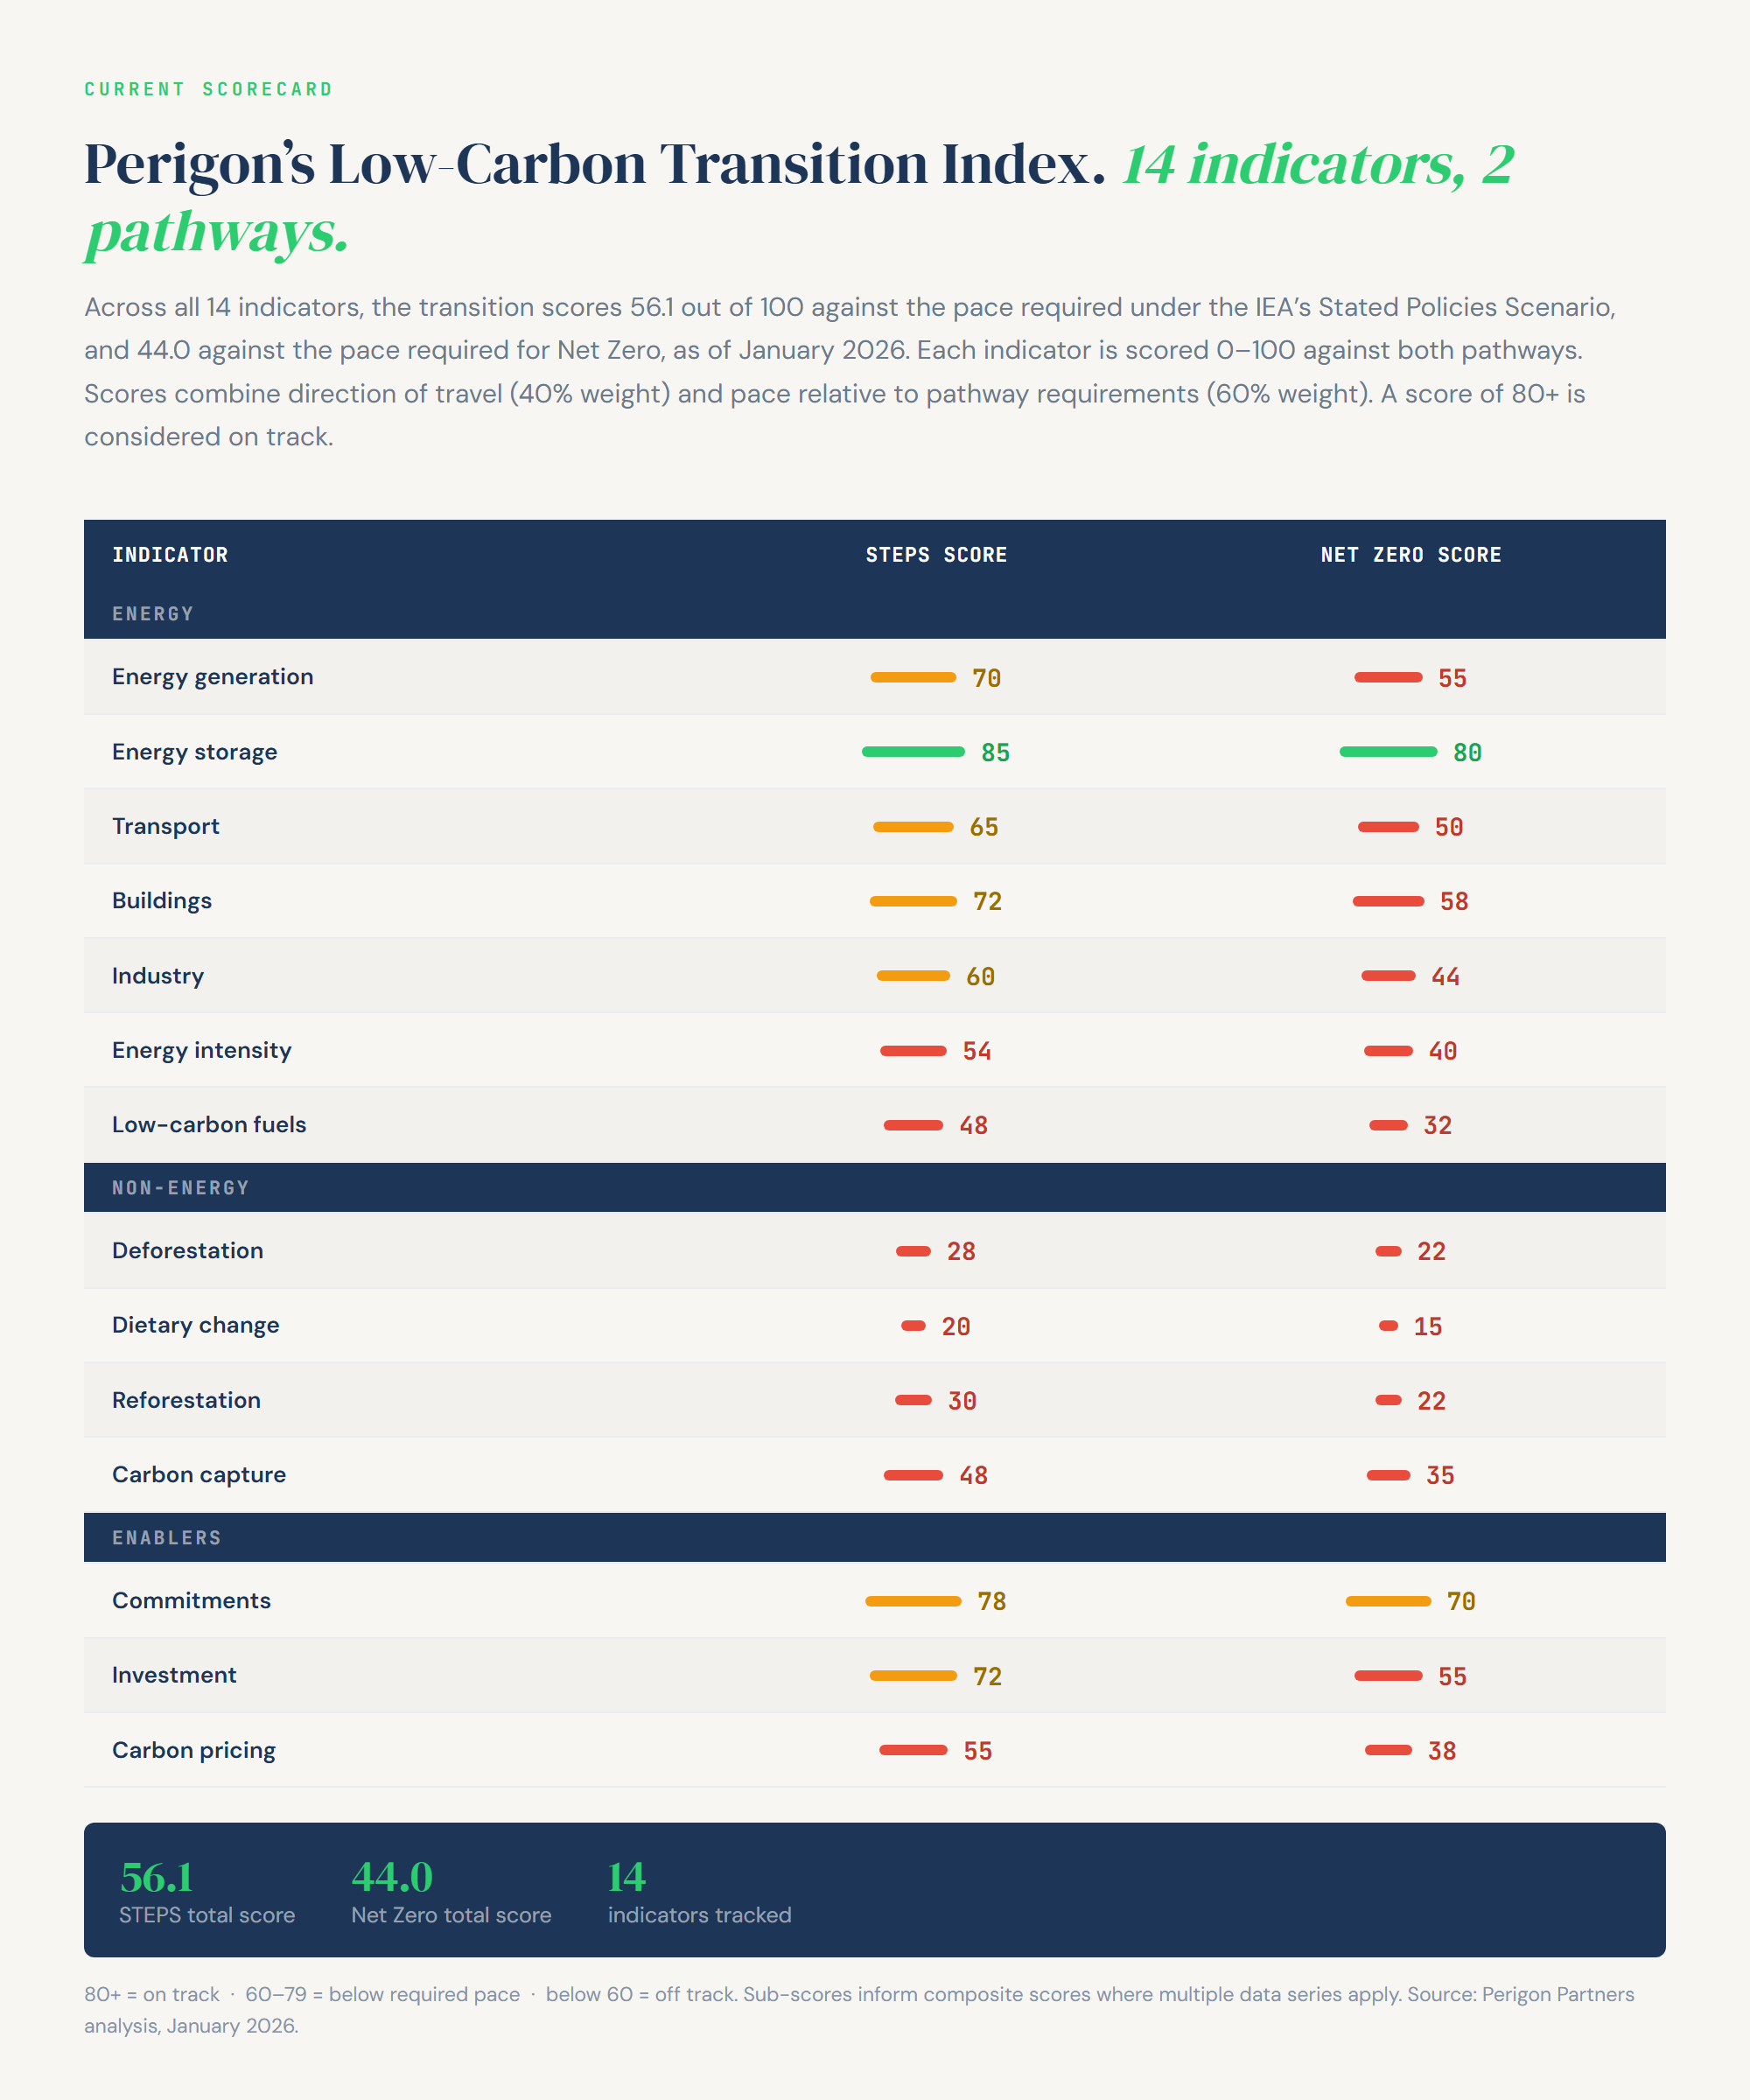
Figure 1: The scorecard that nearly went live. Fourteen confident scores, two confident totals, a tidy methodology note. Almost none of it came from the model.
It is a good-looking table. The bars are coloured, the headings are right, there is a paragraph explaining the weighting and a footnote citing our own analysis. Put it in front of most people cold and they would nod and move on.
Nobody asked the AI to invent anything. It was asked to put the index on the page. Somewhere along the way it stopped copying and started calculating, or simply produced numbers that looked like the kind of numbers that belong in a table like this. It also quietly moved the goalposts: "on track" became 80+ rather than above 75, and the analysis became January 2026 rather than December 2025. None of that was in the model. All of it was plausible.
And it was built by the person in the business who is supposed to know about AI. That's me.
The numbers look plausible
Every organisation already has wrong numbers somewhere. A broken formula, a figure copied from last year's pack. What AI changes is the volume. A small team can now produce more polished, finished-looking material in a week than it used to in a quarter, and the polish is exactly what stops people checking it.
A scrappy draft invites scrutiny. A beautifully typeset table with a methodology note does not.
Now imagine that table was not on a research page but in your board pack. A market sizing in a strategy paper. A KPI in the management accounts. A figure in a regulatory return or a tender response. Your ExCo makes a call on it, perhaps an investment or a market exit, and nobody in the room can say which system the number came from. Nobody lied. Everyone was wrong.
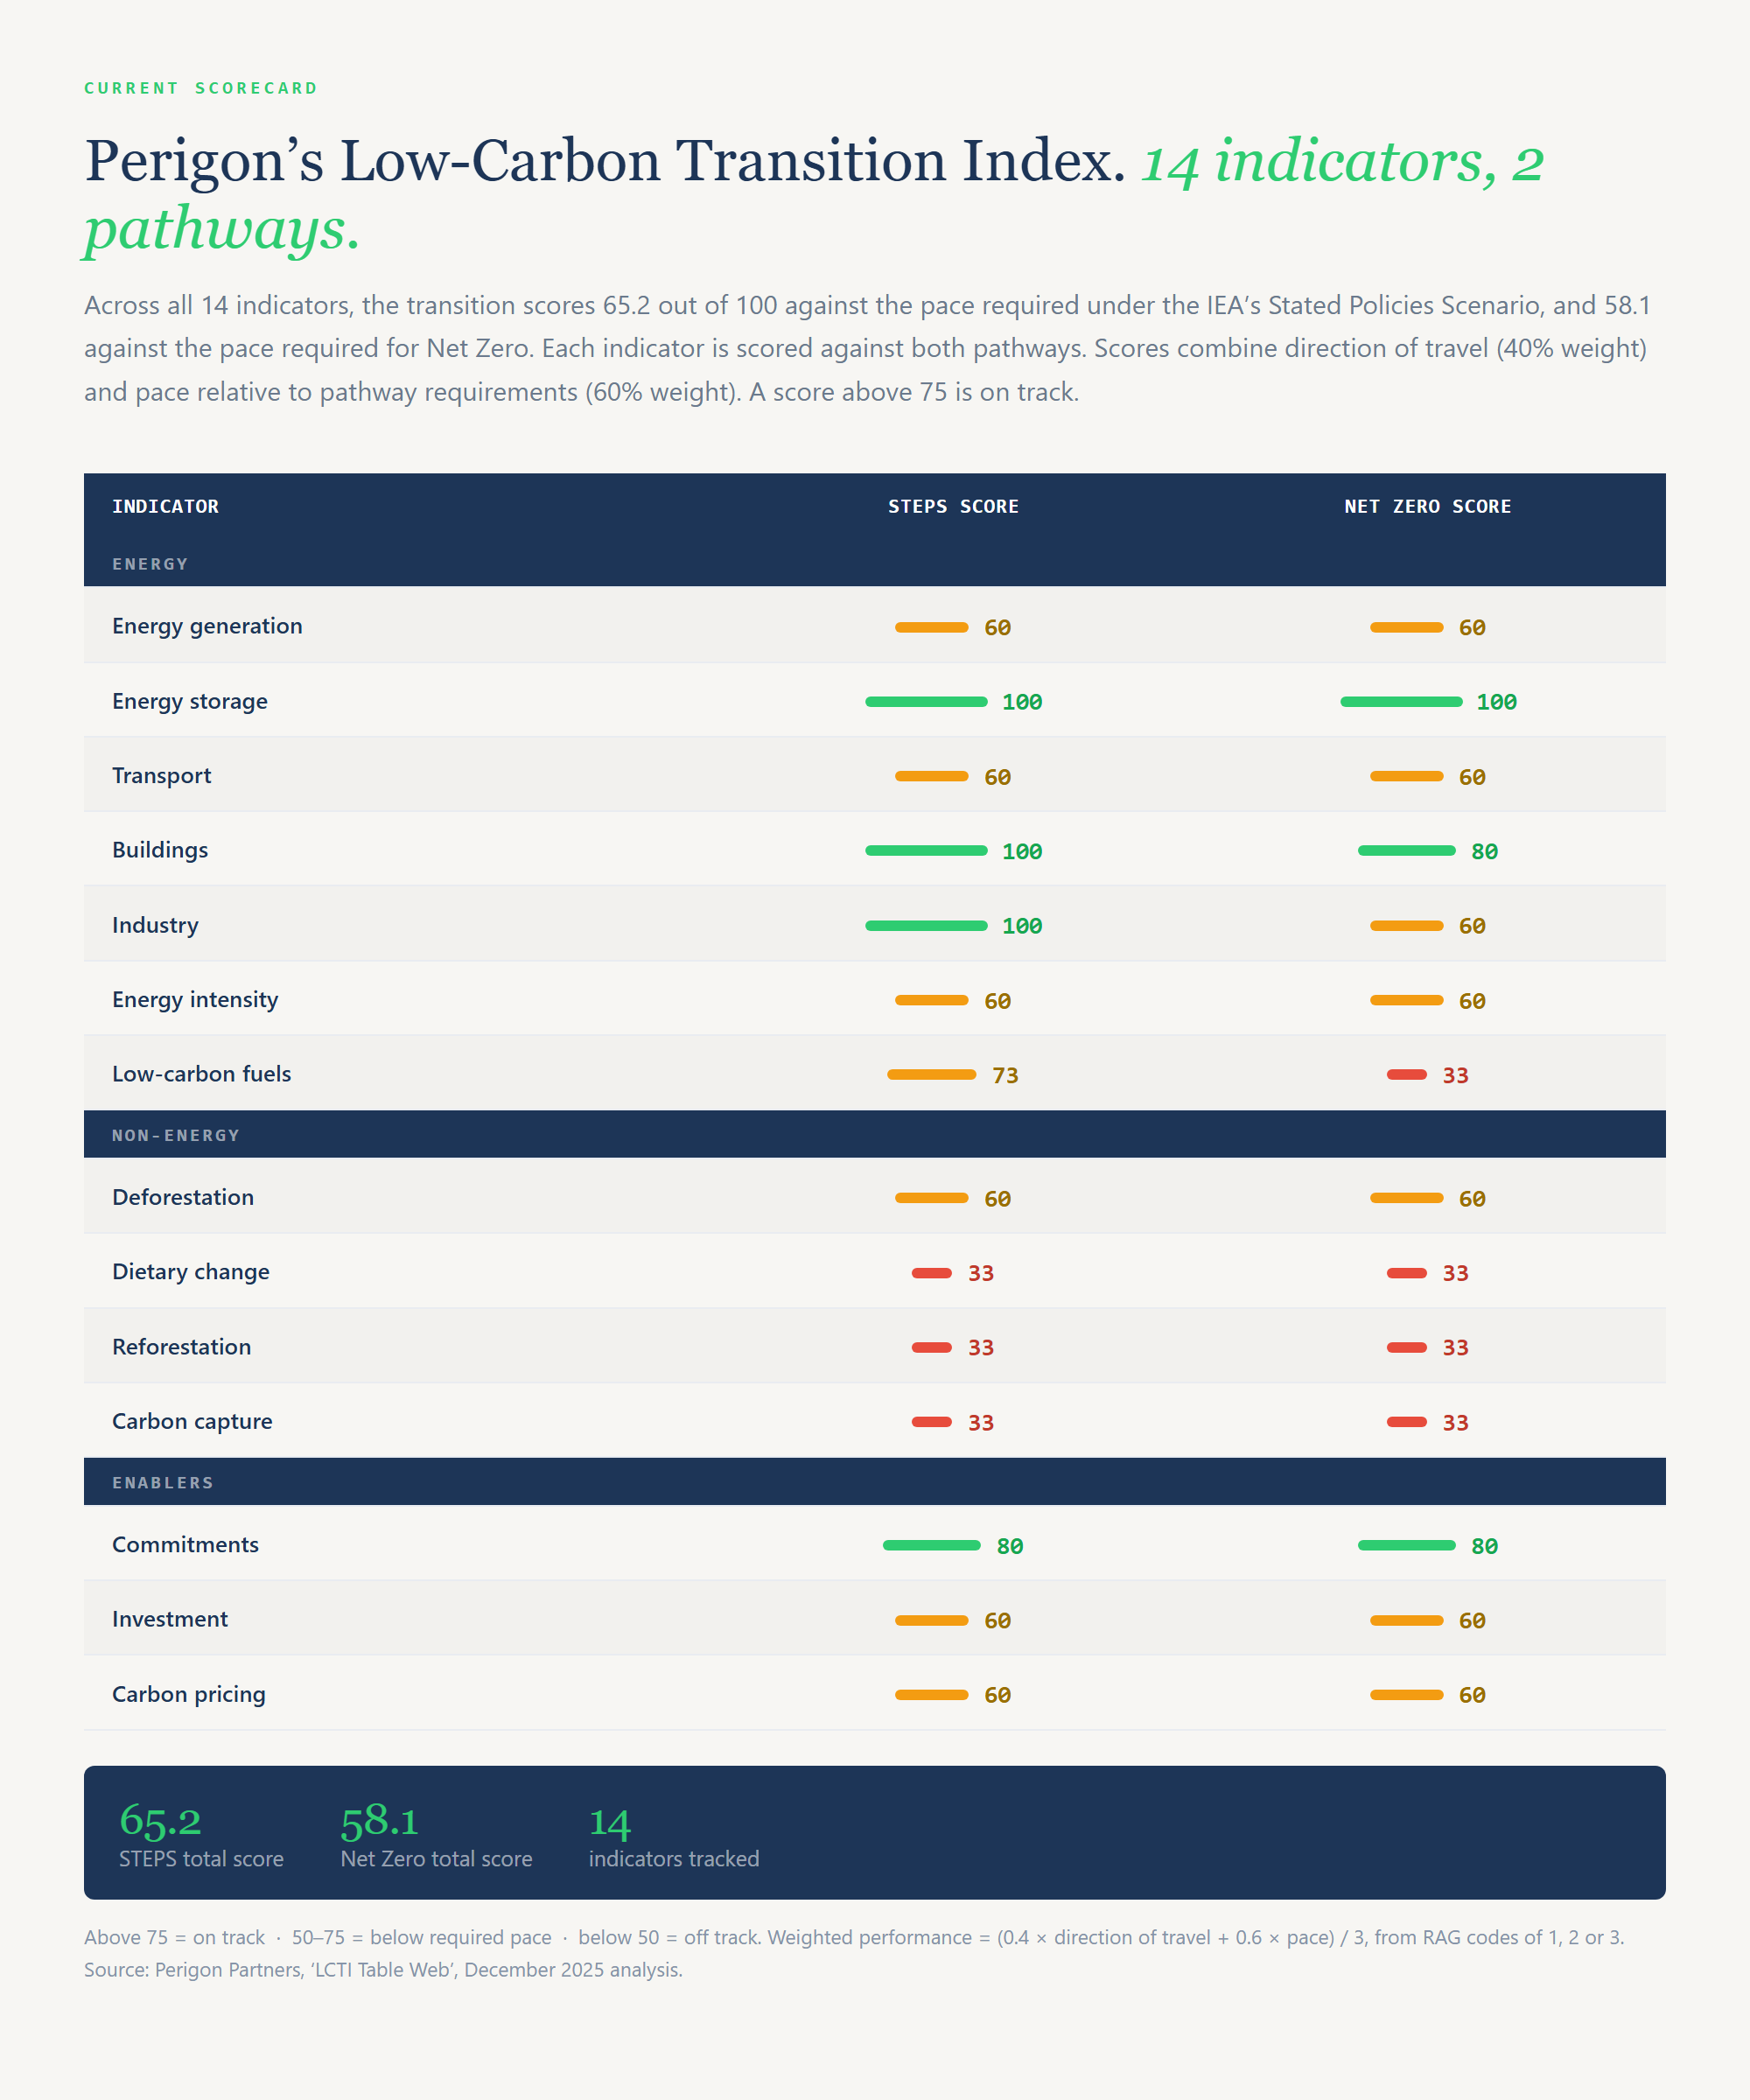
Figure 2: The real scorecard. Notice how few distinct values there are
The humans spotted the mistakes
What caught our error was not a tool or a process. Eventually I noticed an inconsistency, something that did not sit with what I knew of the research, and I could not settle it myself. So I took it to Andrew and Emma, the two people who know the model well enough to look at a score of 72 and say: that number cannot exist.
Because it can't.
Each indicator is built from two red-amber-green ratings, direction of travel and pace, weighted 40/60. That formula only ever produces a small, fixed set of values. The real table shows 33, 60, 73, 80 and 100, over and over. The fake one had 70, 85, 65, 72, 54, 48, 28, 20. Most of those are impossible. It had the shape of the index with none of its logic.
That is not something you spot by being good with AI. You spot it by being the sort of person who reads the footnotes, knows where the numbers come from, and gets uncomfortable when something is too smooth.
Notice what it took. The person who built it had to get a nagging feeling, and then two of the most senior people in the business had to stop what they were doing and check it line by line. In a six-person firm, that is possible.
In a business of 100 to 2,000 people, who plays that role? And are they anywhere near what your AI tools are producing?
In most mid-market businesses there are three or four people whose judgement everything depends on: the CFO, a head of risk, the technical expert who has been there fifteen years. They are already the most stretched people in the building. The typical AI rollout speeds up everything that lands on their desk and does nothing about their desk.
Lessons for a mid-market business
We had the luxury of building from a blank sheet. Most businesses will not. But the lessons that transfer are not about the tools. They are about the operating model around them.
- Design for your scarcest reviewers. Most AI business cases are about producing things faster: drafts, reports, analysis. Production was rarely the constraint. Review is. Speed up drafting without changing review and you have not shortened the queue, you have moved it onto the people who were already the bottleneck. The better question for your ExCo is not "where can we use AI?" but "what would have to change so our most important reviewers look at something once, not four times?"
- Keep every number in one place. Before this, the same research figures had been typed into four different documents at Perigon, and were wrong in three of them. Now they live in one source and everything that publishes them reads from it. Emma approves a number once and it flows everywhere. Your equivalent is a single source of truth for the figures that reach the board, the regulator and your clients.
- Test for what wrong data cannot have. "Someone should double-check it" is not a control. It is a hope, and it fails on the Friday afternoon when everyone is busy. What works is a property the right answer always has and a wrong one usually won't. For our index, it is that fixed set of possible scores, and a script checks it in a second, every time. For you it might be a control total, a reconciliation that has to balance, or a figure that must match across two documents produced independently.
- Know where your data goes. AI adoption is accretive and nobody announces it. Each tool gets added for a good reason by someone solving that week's problem. When a client asked us where their data was processed, tracing the honest answer took a day and turned up more touchpoints, and more gaps in supplier terms, than any of us had assumed. In a business of several hundred people, multiply that. A register of which tools send what data where costs an hour a quarter if you start early. Started late, it is a forensic exercise, and the first person to ask will be a client, an auditor or a regulator.
The lesson I learned
What stays with me is how close it came to not mattering. The table was nearly live. It looked finished. It would have kept looking finished for as long as nobody who knew the model happened to read it closely. It was only a week because I happened to notice, and Andrew and Emma happened to have time to look.
Being AI-native is not really about the AI. It is about whether you still have, and still listen to, the people who notice when something is off. The AI made that table in minutes. It took three people who cared about the detail to make it true.
Does your business have those people, and have you given them the time to look?