Low-Carbon Transition Index. Est 2025.
An annual independent index that digs beneath the perception to track global real-economy progress on the low-carbon transition across fourteen indicators.
The reality versus the hype.
Newsflow, fund flows and politics have created a perception of the low-carbon transition (resembling Gartner's hype cycle) that is often at odds with reality. To cut through the noise, Perigon has compiled a Low-Carbon Transition Index (LCTI) to get a clearer view of real progress.
Although absolute emissions continue to rise at a global level, the underlying picture from leading indicators is one of steady positive momentum in the energy transition since the Paris Agreement. That said, a clear acceleration in progress is required to align with the IEA's Stated Policies Scenario (STEPS).
Perigon's LCTI highlights positive direction of travel across key energy-related and enabler indicators in 2024. However, non-energy-related indicators are behind in both measures of performance.
There will be a low-carbon transition. The extent to which, and by when, we reach net zero may vary significantly across sectors and regions. Strong growth in targets and investment would support an acceleration in the LCTI, though likely still short of the required rate.
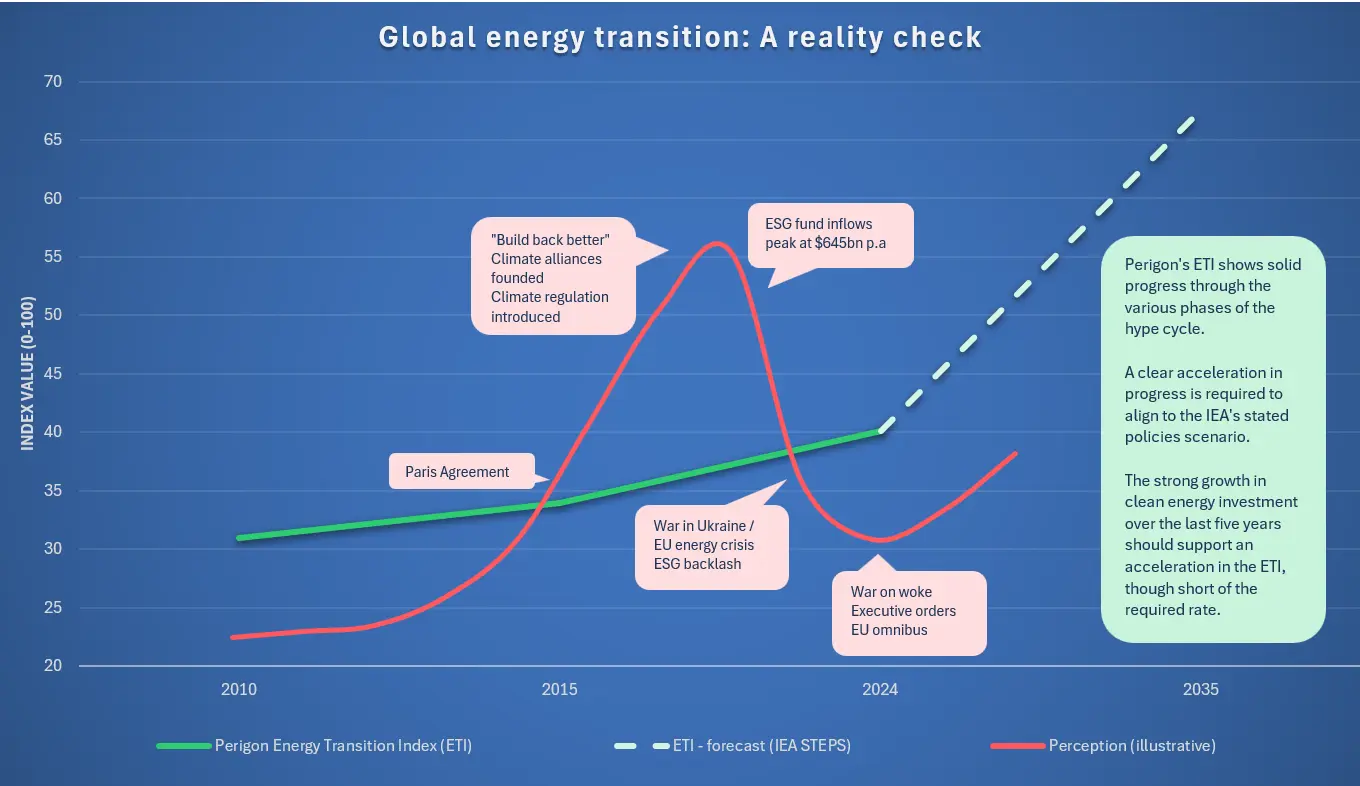
Source: Perigon Partners analysis, January 2026. Perigon's ETI comprised of seven energy-related indicators including the greening of electricity generation and increasing battery storage capacity; as well as the electrification of transport, buildings and industry; the reduction in the energy intensity of GDP and the increasing share of low carbon fuels.
Examining annual performance of the broader low-carbon transition components shows a more nuanced picture with acceleration required.
Perigon's LCTI scores fourteen indicators on direction of travel and performance relative to the pace required to align to the IEA's 2035 Stated Policies goals and its Net Zero Scenario. For non-energy indicators, we track against equivalent pathways where available. We combine directional and relative performance scores for each indicator to produce our index scores.
| Category | Sub-category | Indicator | Metric | Annual change in metric | Low-carbon Transition Index (LCTI) | |||
|---|---|---|---|---|---|---|---|---|
| Direction of travel | Relative to scenario requirement | Weighted performance | Score / 100 | |||||
| Real-economy Transition Progress Indicators | Energy-related | Green the Grid | Energy generation | CO₂ intensity of electricity generation (g CO₂ per kWh) | 64.8 | |||
| Energy storage | Battery storage capacity share of total power capacity (%) | |||||||
| Electrify everything | Transport | Electricity share of total final transport energy consumption (%) | ||||||
| Electrify everything | Buildings – Electrification | Electricity share of total final building energy consumption (%) | ||||||
| Industry | Electricity share of total final industry energy consumption (%) | |||||||
| Improve efficiency – Production | Energy intensity | Change in global primary energy intensity (energy supply to GDP) | ||||||
| Improve efficiency – Consumption | Low-carbon fuels | Sustainable fuels share of total final energy consumption (%) | ||||||
| Non-energy-related | Change land use – Land-cover | Deforestation | Rate of change in deforestation (%) | |||||
| Change land use – Diet | Dietary change | Rate of change in per capita meat consumption by type | ||||||
| Capture carbon – Nature-based | Reforestation | Rate of change in reforestation (%) | ||||||
| Capture carbon – Tech-based | Carbon capture | Rate of change in carbon capture (%) | ||||||
| Transition Enabler Indicators | Enable the transition | Commitment | Commitments and targets: % of global market cap covered by net zero commitments or targets | 66.7 | ||||
| Investment | Investment in climate transition: annual investment in energy transition ($) | |||||||
| Pricing | Carbon pricing: change in average carbon price ($/tCO₂) | |||||||
Perigon's LCTI assigns each metric a score for its performance vs. the prior year (direction of travel) and a score for that performance relative to what is required to align to the 2035 goals of the stated policies scenario (STEPS). The two scores are then combined for each metric, with a higher weighting (60%) applied to relative performance, before being aggregated into the overall real-economy and enabler scores out of 100.
Source: Perigon Partners analysis, January 2026.
Explore the research and data behind Perigon's LCTI.
We aim to provide a single, rich source of consolidated data and research to paint a clear and detailed picture of what is really happening with the global climate transition. Use this to inform your company's plans and provide context to the Board and ExCo.
Emissions are still rising globally. But the trajectory is shifting.
Global CO₂ emissions from burning fossil fuels reached nearly 40 billion tonnes in 2024, though the rate of growth has slowed by around 60% since 2010. The picture varies sharply by region, sector and income level. High-income countries are increasingly decoupling growth from emissions, while China and the rest of Asia continue to push global totals higher. The UK is one of the clearest examples that deep decarbonisation and economic growth can happen at the same time.
Globally, absolute annual emissions continue to grow
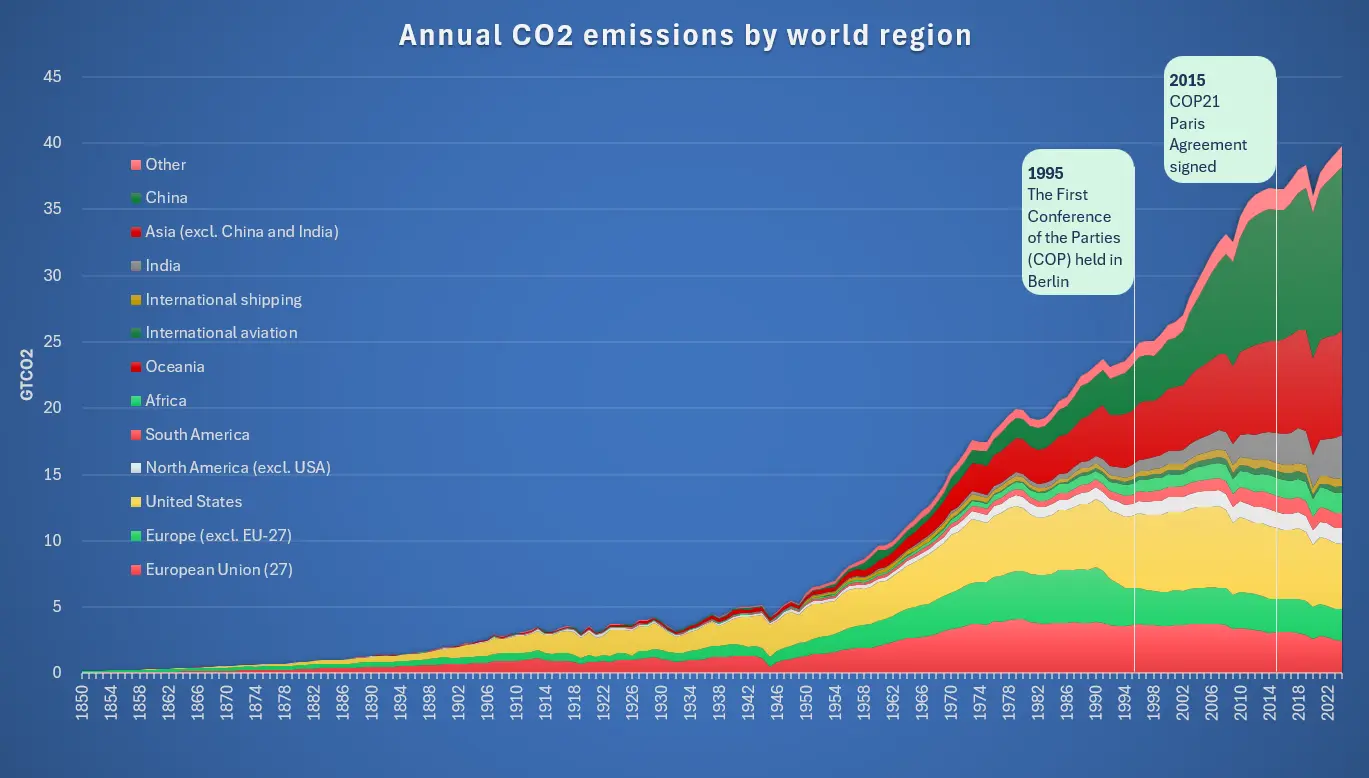
Global CO₂ emissions from burning fossil fuels reached nearly 40 billion tonnes in 2024, and have yet to peak, a decade on from the Paris Agreement.
- Limiting warming to the goals of the Paris Agreement, and minimising the risk of triggering global tipping points, requires immediate and steep cuts to CO₂ and other greenhouse gas emissions
- Emissions have grown rapidly since the first UN climate conference under the UNFCCC in 1995, though the pace of growth has slowed since the Paris Agreement was signed in 2015
- Ten years on from Paris, the primary source of human-caused emissions, the burning of fossil fuels, has yet to peak
- These figures exclude emissions from land-use change
The pressure to decarbonise isn’t going to ease on its own. The global peak that would take some of the urgency out of climate policy intervention hasn’t arrived yet.
Source: Hannah Ritchie (2022), “CO₂ emissions dataset: our sources and methods” Published online at OurWorldInData.org. Retrieved from: ‘https://archive.ourworldindata.org/20251125-173858/co2-dataset-sources.html’ [Online Resource] (archived on November 25, 2025).
Emissions growth is predominantly driven by China
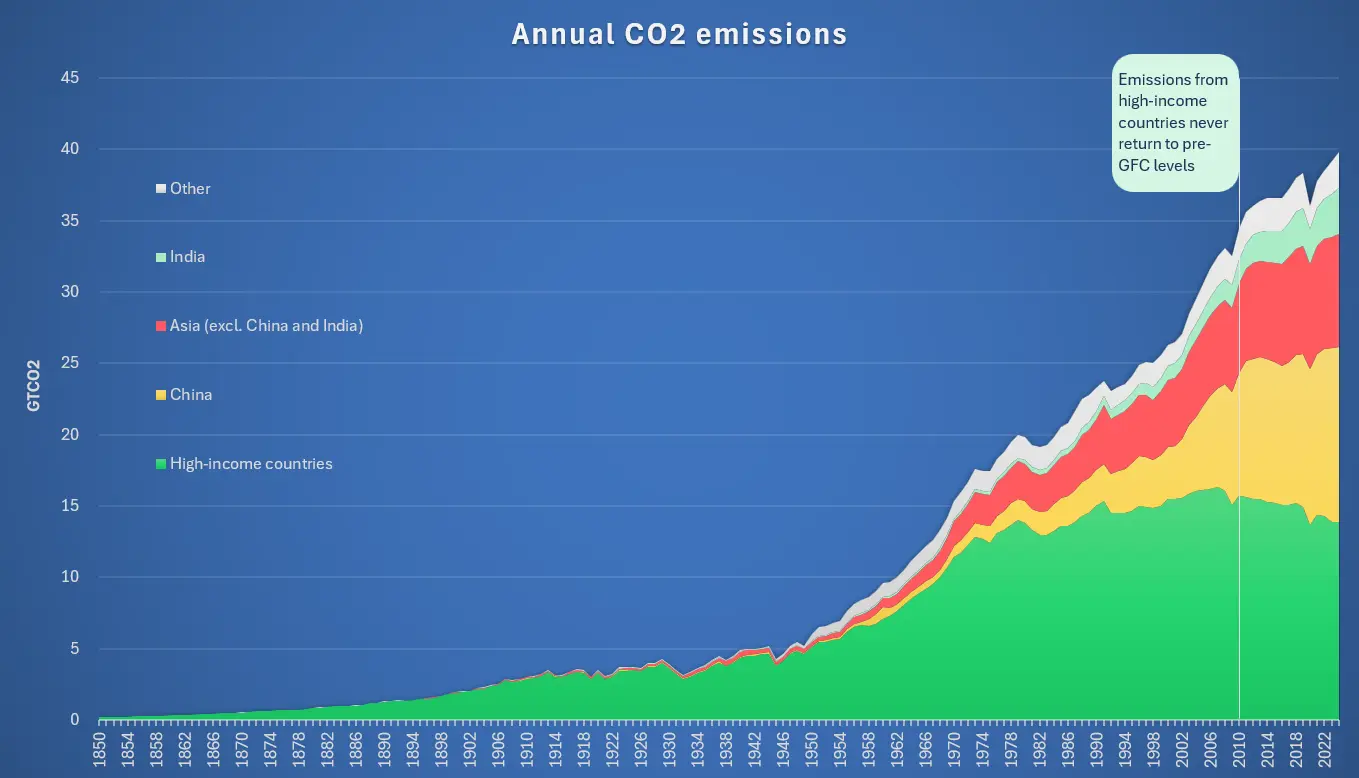
China and the rest of Asia, excluding India, now account for roughly half of all annual global CO₂ emissions.
- High-income countries, though responsible for the majority of historical emissions, have been reducing their annual CO₂ emissions over the past 15 years
- That reduction has been more than offset by strong growth in China’s emissions over the same period
Domestic decarbonisation matters, but it only addresses part of the picture. The direction of the global transition now hinges heavily on the pace of change in China and the rest of Asia.
Source: Hannah Ritchie (2022), “CO₂ emissions dataset: our sources and methods” Published online at OurWorldInData.org. Retrieved from: ‘https://archive.ourworldindata.org/20251125-173858/co2-dataset-sources.html’ [Online Resource] (archived on November 25, 2025).
Emissions per capita are falling in most regions, with China and India the exceptions
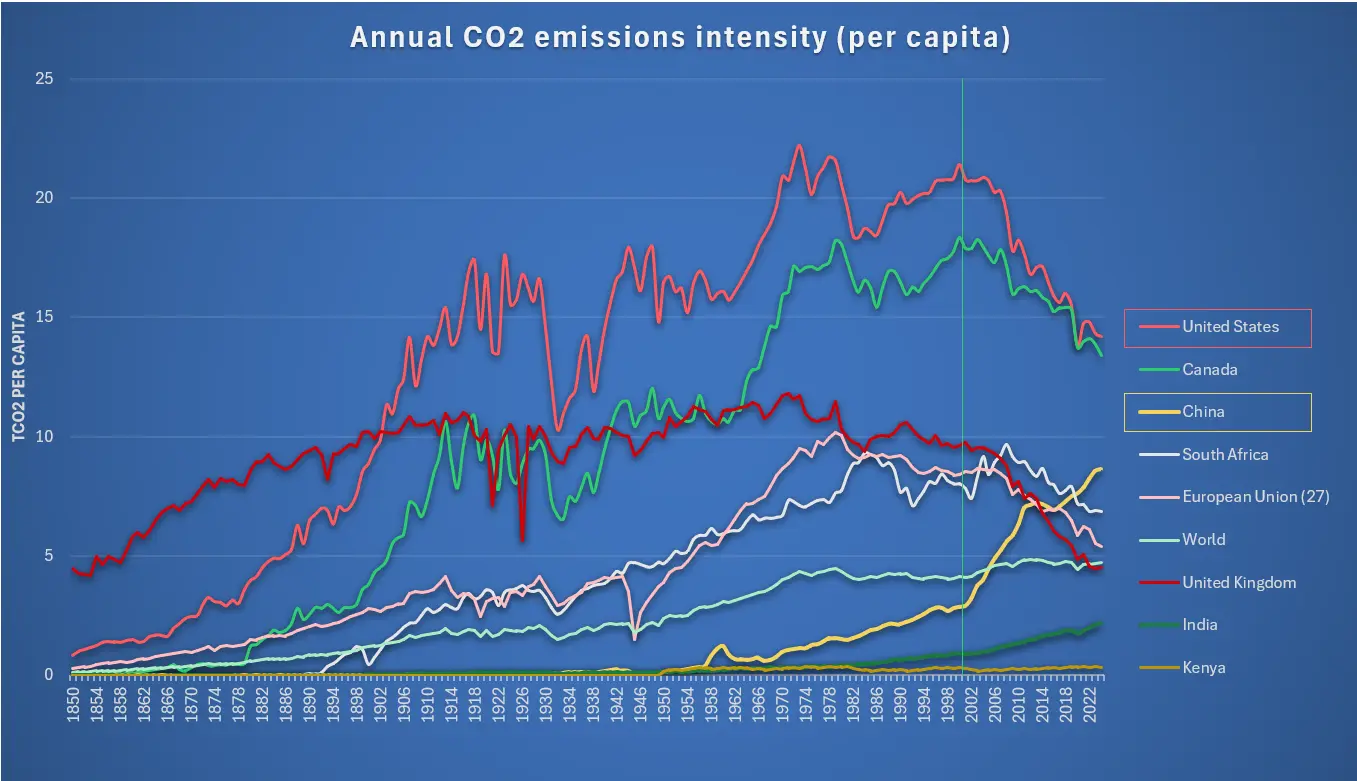
Global emissions per capita have stayed relatively flat overall, but that masks sharp regional divergence, with China and India rising while other major economies fall.
- Declines in per capita emissions in the US and EU over the past 25 years have been offset by strong growth in China
- North America remains the most emissions-intense region per capita, despite these reductions
- Because these figures are domestic and don't account for traded goods, some of the fall in the US, Canada and Europe may reflect the shift of manufacturing to China rather than genuine demand reduction
- Figures include CO₂ emissions from burning fossil fuels and industrial processes, covering transport, electricity generation and heating, but exclude land-use change
A falling domestic emissions figure doesn’t necessarily mean a falling footprint, once outsourced manufacturing is accounted for. Worth remembering for any business reliant on global supply chains.
Source: Hannah Ritchie (2022), “CO₂ emissions dataset: our sources and methods” Published online at OurWorldInData.org. Retrieved from: ‘https://archive.ourworldindata.org/20251125-173858/co2-dataset-sources.html’ [Online Resource] (archived on November 25, 2025).
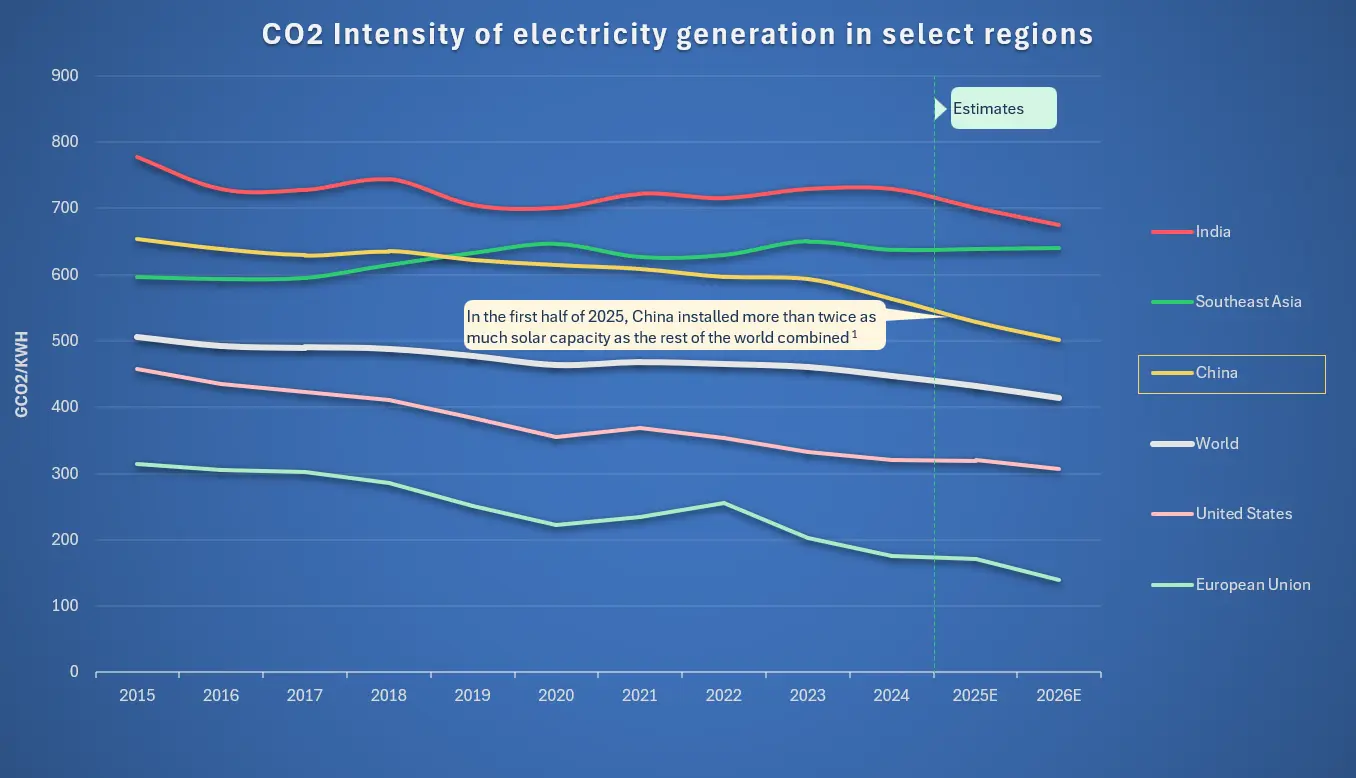
Emissions from power generation are plateauing, even in China
Global emissions from electricity generation have plateaued over the past decade, and multiple regions, including China, are expected to see falling power-sector emissions out to 2026.
- The largest absolute decrease is expected in China, driven by rapid renewable energy deployment and rising nuclear generation
- These figures are highly sensitive to swings in electricity demand, which can move sharply with economic activity and weather conditions
This is one of the clearest signals that the cost case for clean power now stands on its own, even in the world’s largest emitter.
Source: Hannah Ritchie (2022), “CO₂ emissions dataset: our sources and methods” Published online at OurWorldInData.org. Retrieved from: ‘https://archive.ourworldindata.org/20251125-173858/co2-dataset-sources.html’ [Online Resource] (archived on November 25, 2025).
Reference (in chart): Ember, September 2025.
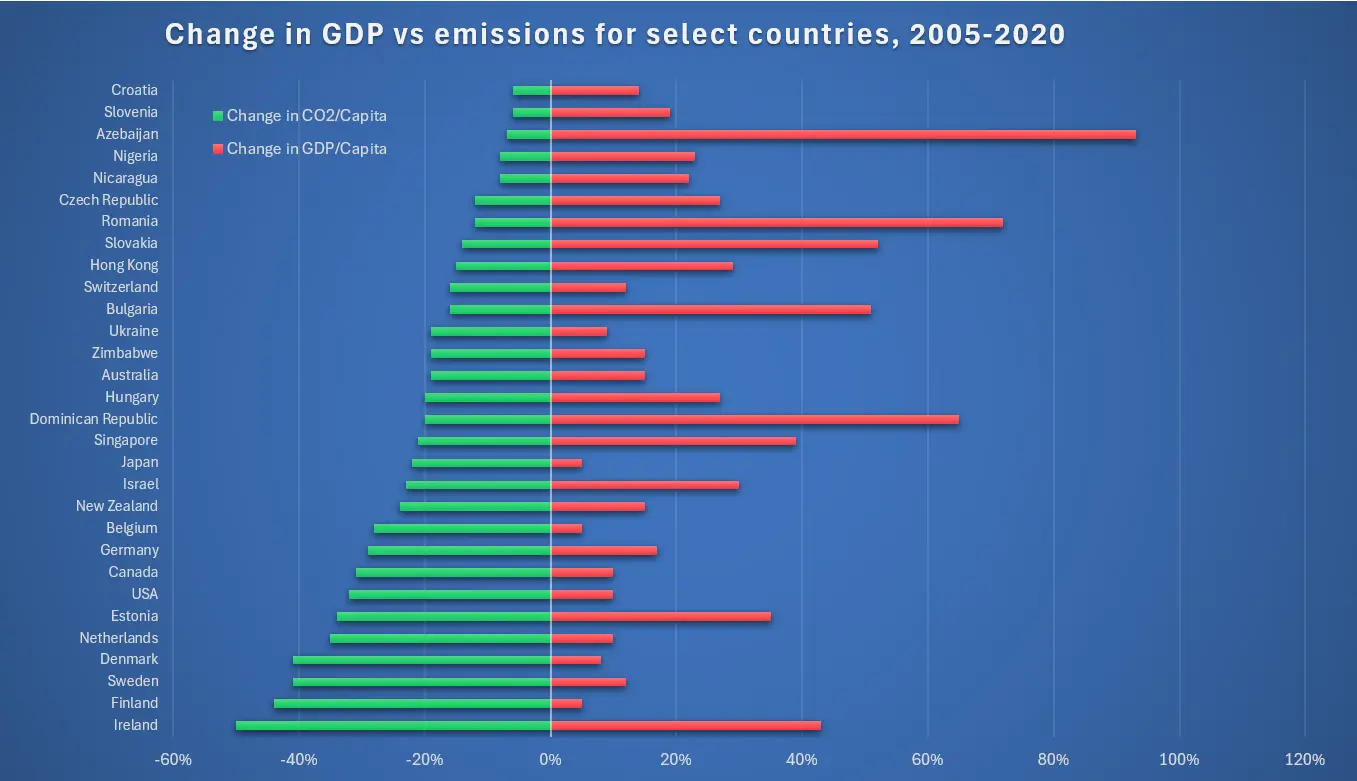
Many countries have managed to grow their economies while cutting emissions
A significant number of countries across Europe, North America and beyond decoupled economic growth from CO₂ emissions between 2005 and 2020.
- The UK, Germany, France and most EU economies achieved meaningful reductions in CO₂ per capita while growing GDP per capita over this period
- This shows the low-carbon transition and economic growth aren't mutually exclusive, though the pace and depth of decarbonisation still varies significantly by country
- Because these figures are domestic and don't account for traded goods, some of the falls may reflect the offshoring of manufacturing and industrial processes
For any board still weighing decarbonisation against growth as a trade-off, this is the direct counter-evidence. Enough economies have now done both at once for it to be a normal outcome, not an exception.
Source: Hannah Ritchie (2022), “CO₂ emissions dataset: our sources and methods” Published online at OurWorldInData.org.
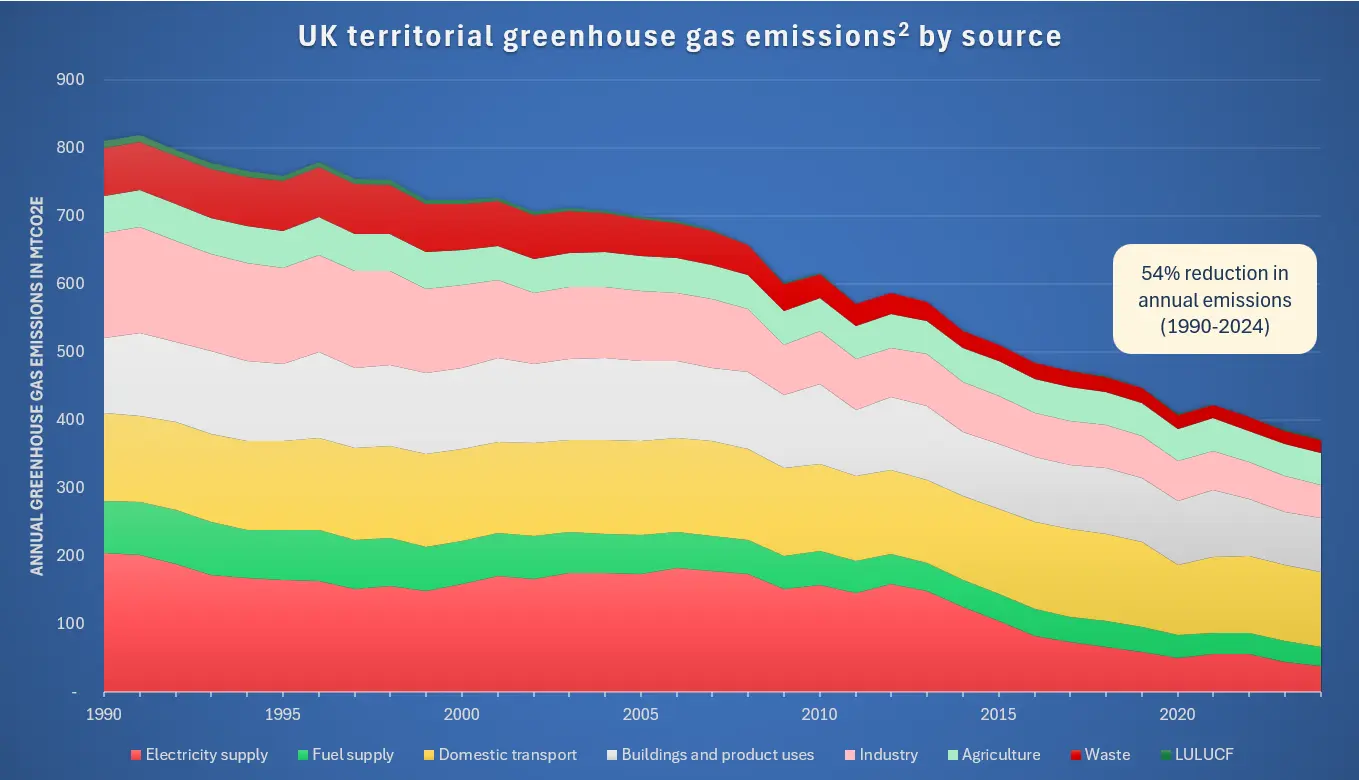
The UK has halved its annual emissions since 1990, despite the economy growing nearly 80%
The UK cut its annual emissions by 50% between 1990 and 2022, while growing its economy by nearly 80% over the same period.
- UK territorial emissions (those occurring within UK borders plus international aviation and shipping) were 413.7 MtCO₂e in 2024, the tenth consecutive year of sustained reduction, excluding the COVID-19 years of 2020 and 2021
- Most of the reduction has come from decarbonising the electricity supply and de-industrialisation trends; the UK’s last coal-fired power plant closed in October 2024
- Over 80% of the emissions savings still needed between now and 2030 must come from sectors other than energy supply
- Domestic transport, including aviation, is now the UK’s largest source of annual emissions, followed by buildings and product use
The easy wins, largely won by decarbonising power, are mostly banked. The next phase of reduction runs through transport and buildings, sectors that touch far more consumers directly and are harder to shift.
Source: UK Government (2024), “UK first major economy to halve emissions” press release; UK Climate Change Committee (2025), Seventh Carbon Budget; DESNZ (2025) Final UK greenhouse gas emissions national statistics: 1990 to 2023 and Provisional UK greenhouse gas emissions statistics: 2024.
Policy, capital and commitments all moving forward.
Despite unprecedented political headwinds, the structural enablers of the low-carbon transition kept strengthening through 2025. All 37 jurisdictions tracked by the Oxford Climate Policy Monitor increased policy ambition. Corporate science-based targets now cover over 40% of global market capitalisation, clean energy investment reached $2.1 trillion, and under every NGFS scenario, the carbon price is set to exceed $100 per tonne by 2030.
Despite political uncertainty, 2025 saw continued climate policy strengthening
Every one of the 37 jurisdictions tracked by the Oxford Climate Policy Monitor has increased climate policy ambition since 2020, with the United States the only jurisdiction to record a formal rollback.
- Growth in rule-making activity and ambition has been particularly pronounced in rules covering climate-related disclosures, carbon credits and methane
- Progress has been more incremental on rules governing transition planning, public procurement and green prudential standards for the financial sector
- The Policy Monitor tracks 37 jurisdictions, covering over 85% of global emissions and 87% of global GDP
For businesses waiting on a policy retreat before committing to transition plans, the data says that bet hasn’t paid off anywhere outside the US. In most jurisdictions the direction of travel has kept hardening.
Source: University of Oxford (2025), Oxford Climate Policy Monitor Annual Review.
Figure 2. Total number of policy tools in force by domain and year
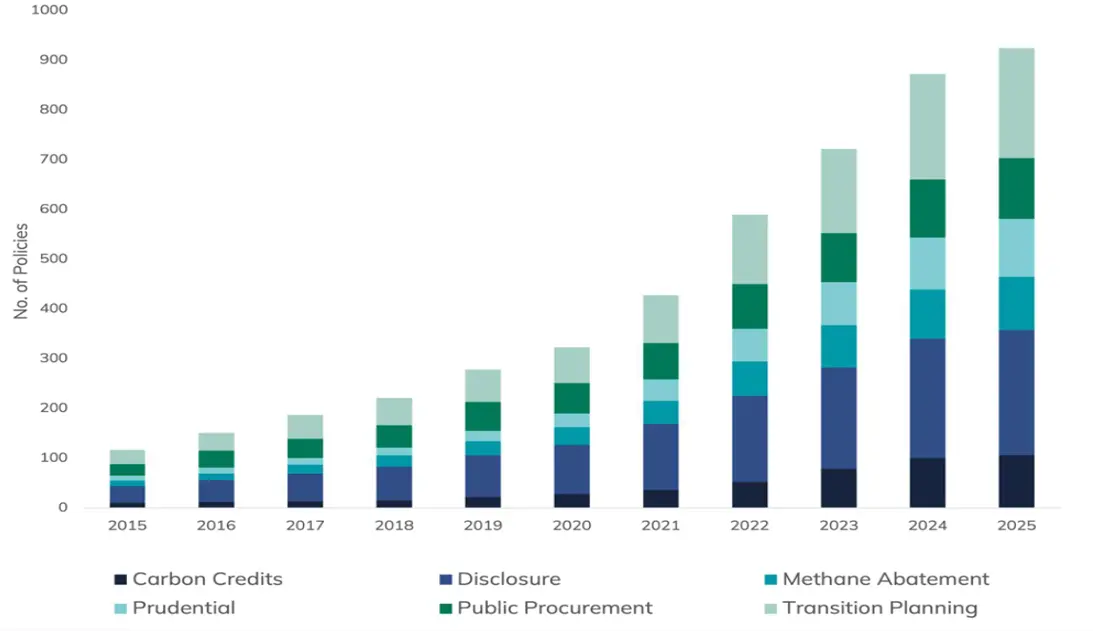
*Policies approved or issued up to July 2025. Note: Policy tools may be relevant to more than one domain (e.g. considered a disclosure and transition planning tool). Therefore, the total number of policy tools mapped in the figure (n=924) is greater than the number of policy tools mapped in the 2024 Oxford Climate Policy Monitor (n=692).
That’s helping underpin growth in corporate climate commitments and targets
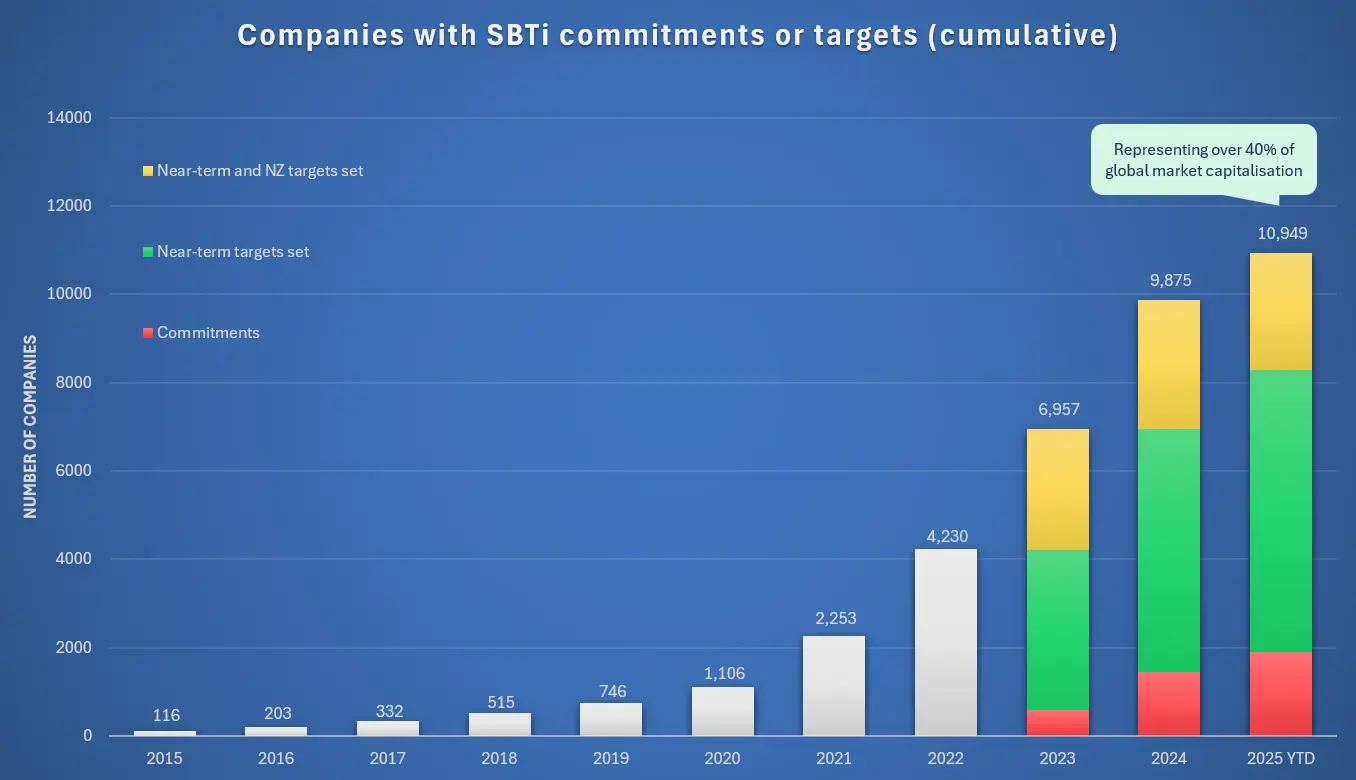
Nearly 11,000 companies have set greenhouse gas reduction targets with the Science Based Targets initiative (SBTi), or committed to set them.
- Science-based targets now cover over 40% of global market capitalisation and a quarter of global revenue
- This growth in corporate ambition is continuing irrespective of policy and geopolitical volatility
- The dataset includes SMEs and financial institutions
Company-level commitment is no longer trailing policy. It’s running as its own independent signal, which matters for any business benchmarking itself against sector peers rather than against regulation alone.
Source: SBTi (2025), Trend Tracker.
Total annual investment in the energy transition has reached $2.1 trillion
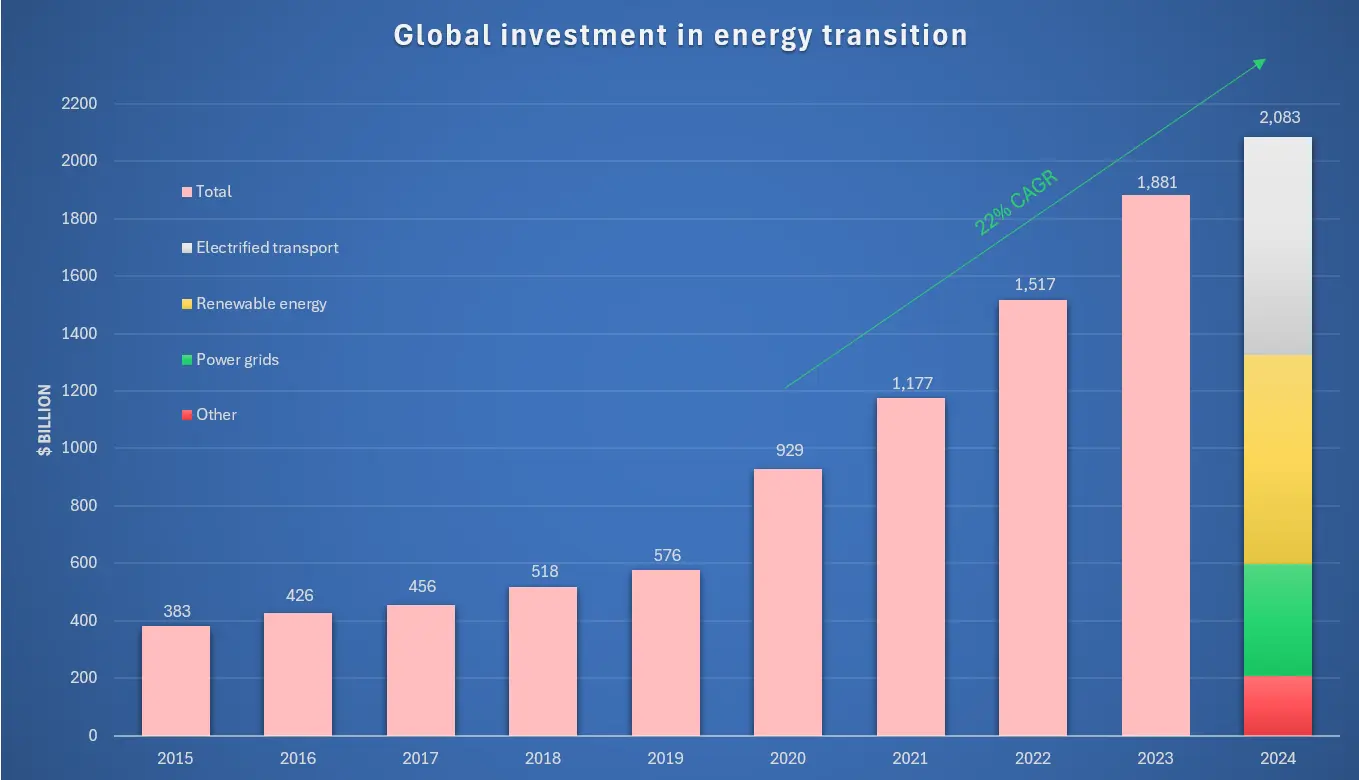
Global investment in the energy transition reached nearly $2.1 trillion in 2024, though annual growth slowed to 11%, down from a 22% average since 2020.
- Mainland China accounted for two-thirds of the global increase seen last year
- The clean energy supply chain attracted $130 billion in new investment, despite ongoing overcapacity
- Equity and debt issuance for climate and energy transition purposes stayed just above $1 trillion
- The Asia Pacific region grew fastest, up 21% year on year, and surpassed $1 trillion in 2024
The slowdown in growth rate is worth watching, but the scale of capital now committed, over $2 trillion a year, means the transition has passed the point where it depends on any single government’s continued support.
Source: BloombergNEF (2025), Energy Transition Investment Trends.
Asset owners and managers expect to keep adding to sustainable AUM
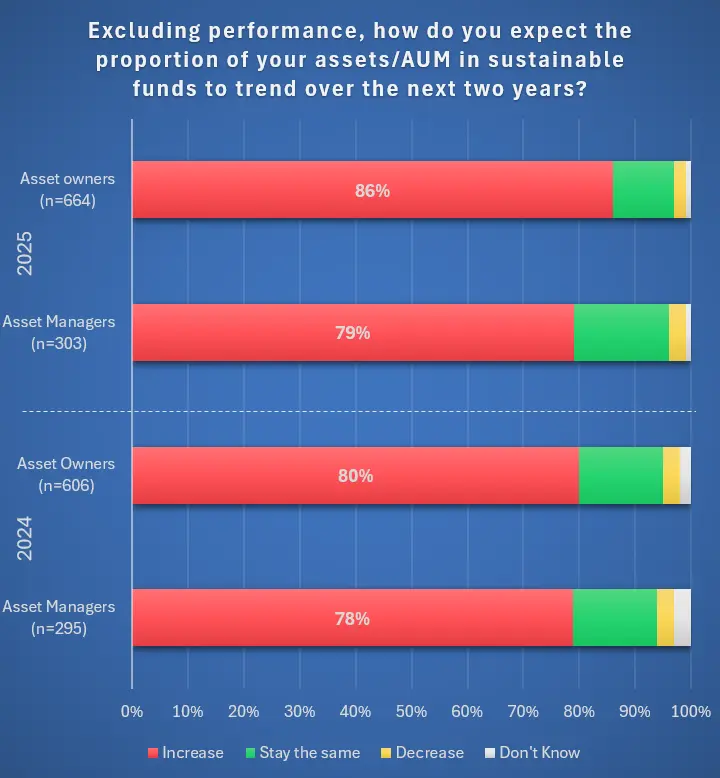
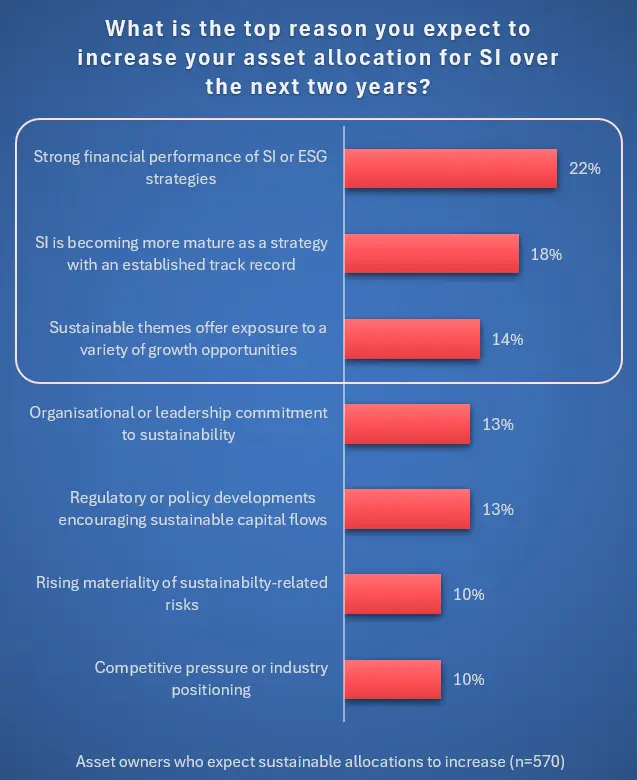
84% of the 900-plus institutional investors surveyed by Morgan Stanley expect the proportion of sustainable assets under management in their portfolios to rise over the next two years.
- Drivers are increasingly performance and opportunity-led, rather than risk and regulatory-led
- Investors remain concerned about a range of challenges to sustainable investing, but still see sustainability as important to managing investment risk
- Energy efficiency and renewable energy remain the top two sustainable investment priorities, with climate adaptation rising to third
The shift from a compliance-led to a returns-led rationale among investors matters for boards. Sustainability performance is increasingly read as a proxy for management quality, not just regulatory compliance.
Source: Morgan Stanley Institute for Sustainable Investing (2025), 2025 Sustainable Signals survey.
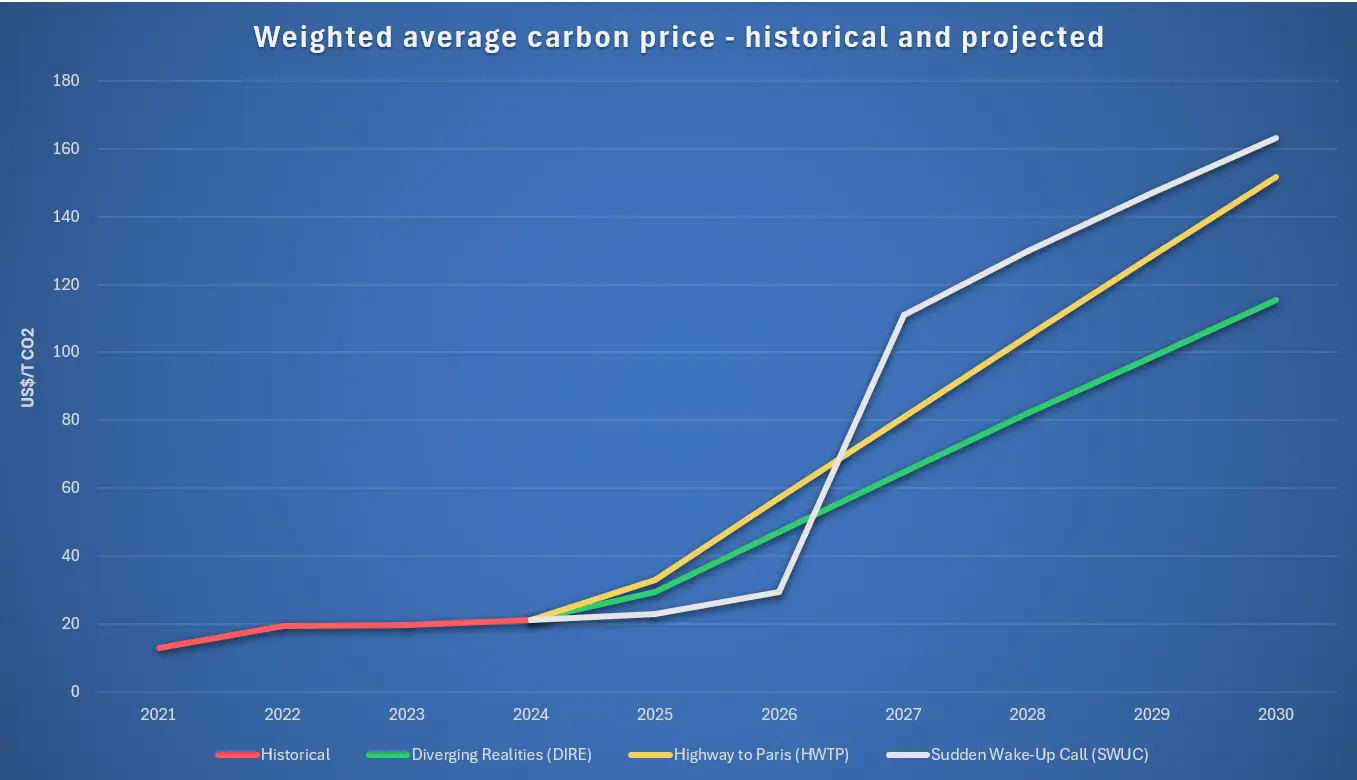
A substantial increase in the carbon price is expected under all NGFS transition scenarios
Under every NGFS short-term scenario, the weighted average carbon price is expected to exceed $100 per tonne by 2030, around five times the current price.
- A well-paced, globally coordinated rollout of climate policy, with gradual carbon price increases and effective recycling of carbon tax revenues into green investment, limits the negative effects of the transition, according to the NGFS
- A sudden, sharp rise in carbon price, as modelled in the Sudden Wake-Up Call scenario, would trigger a strong inflationary spike
Whichever path policy takes, the direction on carbon pricing is the same. Businesses planning capital allocation on the assumption that today’s carbon price holds are planning against a scenario the NGFS itself considers unlikely.
Source: NGFS (2025), Short term climate scenarios.
Every major energy indicator is moving in the right direction. The question is how fast.
Renewables now account for over 90% of new power capacity globally. Electric vehicle sales have exceeded 17 million. Battery storage is scaling rapidly. Energy intensity is falling. The direction of travel is clear and consistent. What remains uncertain is whether the current pace is sufficient: under even the less demanding IEA Stated Policies Scenario, most indicators need to accelerate meaningfully between now and 2035.
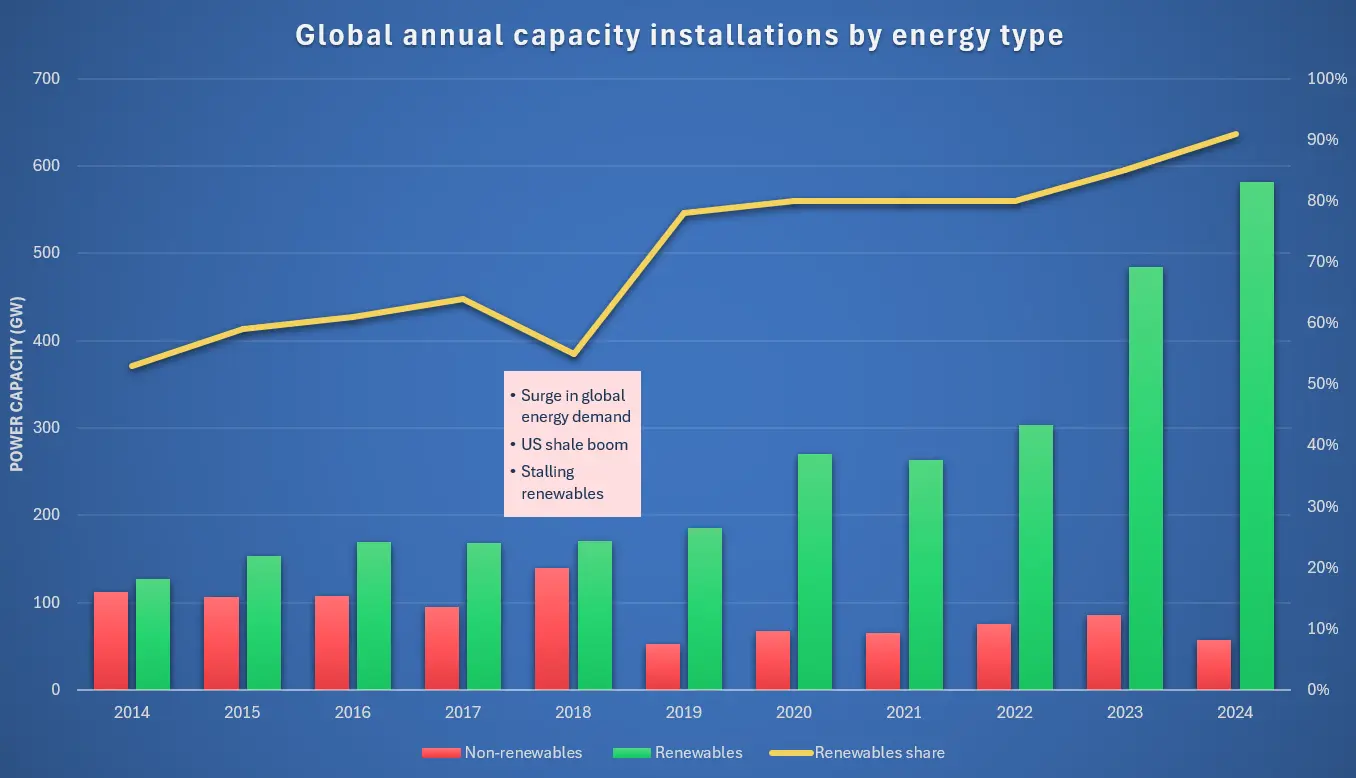
Renewables now clearly dominate annual power capacity expansion
Renewables accounted for over 90% of total power capacity expansion globally in 2024, up from 85% in 2023.
- Their share of the world’s total installed power capacity rose from 43% to 46% over the same period, reflecting faster renewable adoption and a slowdown in non-renewable capacity additions
- As the levelised cost of electricity from most forms of renewable power keeps falling, renewables are now the most cost-effective power source in most countries, as well as the cleanest
This is no longer a subsidy story. When the cheapest new power capacity is also the cleanest, the investment case for renewables holds even where climate policy is weak or absent.
Source: IRENA (2025), Renewables in 2024: 5 Key Facts Behind a Record-Breaking Year.
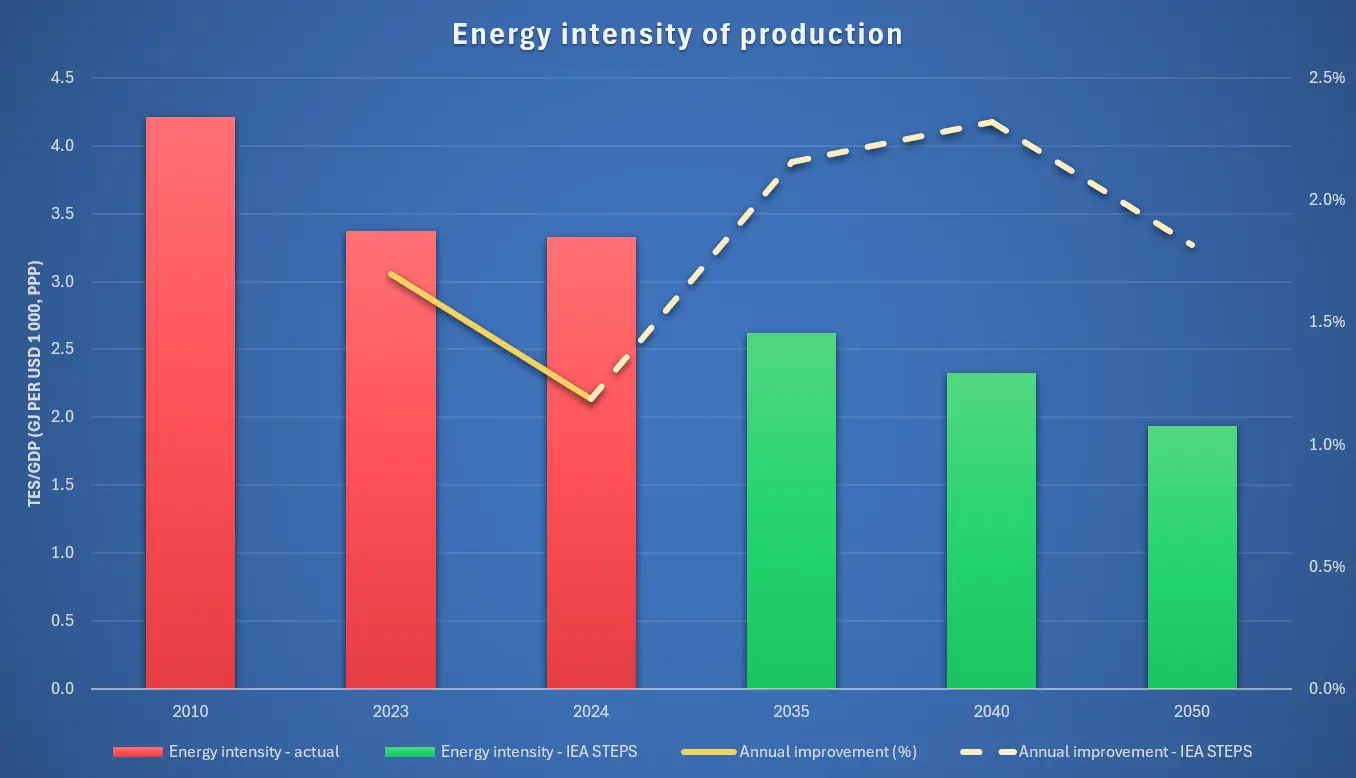
The energy intensity of production is decreasing steadily but needs to pick up pace
Global energy intensity improved by 1.2% in 2024, reaching 3.33 gigajoules per USD 1,000 of output.
- To align with the IEA’s Stated Policies Scenario (STEPS), the annual rate of improvement needs to nearly double, to 2.2% a year, between 2024 and 2035
- The IEA’s Net Zero scenario requires a 4.1% annual improvement in energy intensity over the same period
Efficiency gains are compounding in the right direction, just too slowly. Businesses waiting for energy intensity to improve on its own, without active investment in efficiency, are relying on a pace the IEA itself says falls short.
Source: IEA (2025), World Energy Outlook.
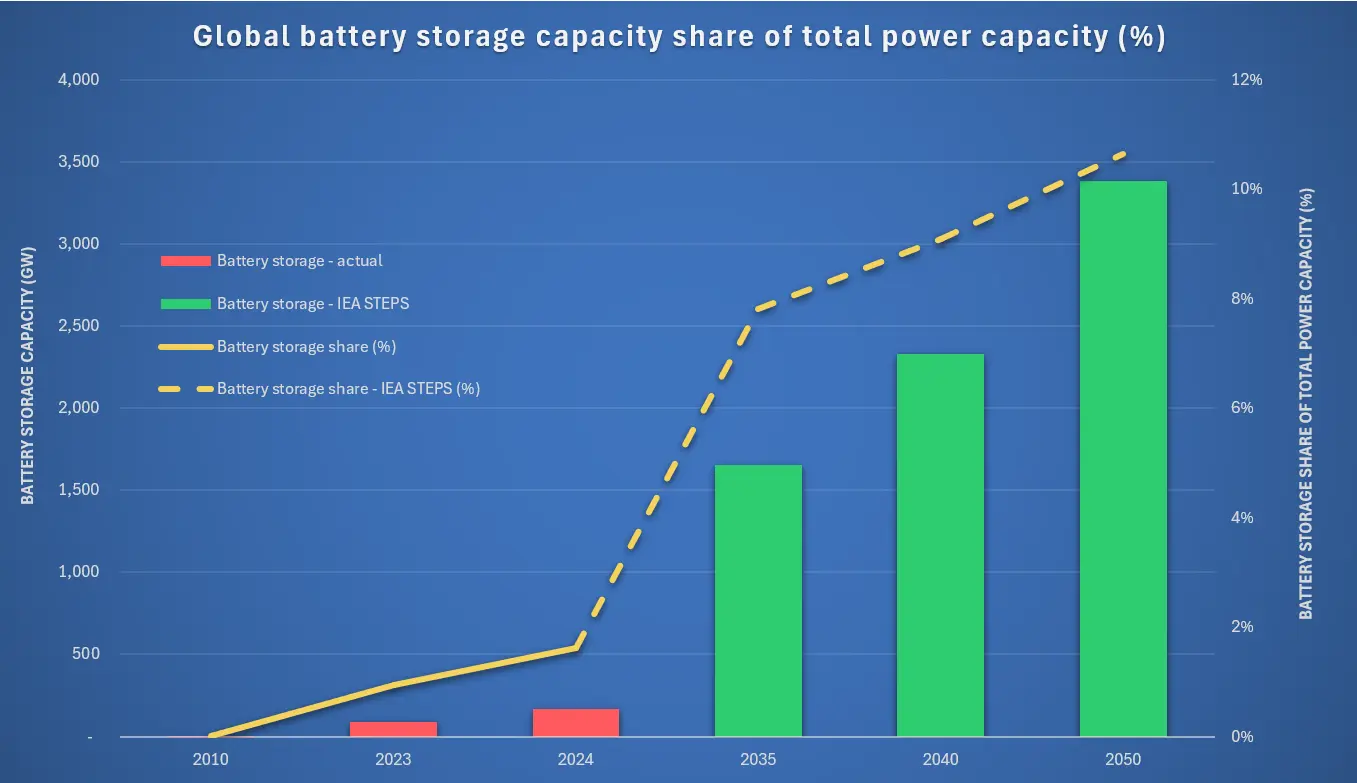
Energy storage growth continues despite adverse policy shifts
Global energy storage additions are expected to grow 23% in 2025, despite adverse policy shifts and tariff challenges in the two largest markets, China and the US.
- Annual deployments are also set to scale in Germany, the UK, Australia, Canada, Saudi Arabia and Sub-Saharan Africa, driven by supportive policy, utility procurement and power market dynamics
- Storage capacity needs to grow tenfold between 2024 and 2035 to align with the IEA’s Stated Policies Scenario
- Sources expect cumulative storage capacity to reach 2 terawatts, eight times the 2025 level, as installations keep gaining momentum over the next decade
Storage is becoming the sector’s least policy-dependent growth story. It’s scaling on market economics even where the two largest markets have turned less supportive.
Source: IEA (2025), World Energy Outlook; BloombergNEF (2025), 2H 2025 Energy Storage Market Outlook; BloombergNEF (2025), Global Energy Boom: Three Things to Know.
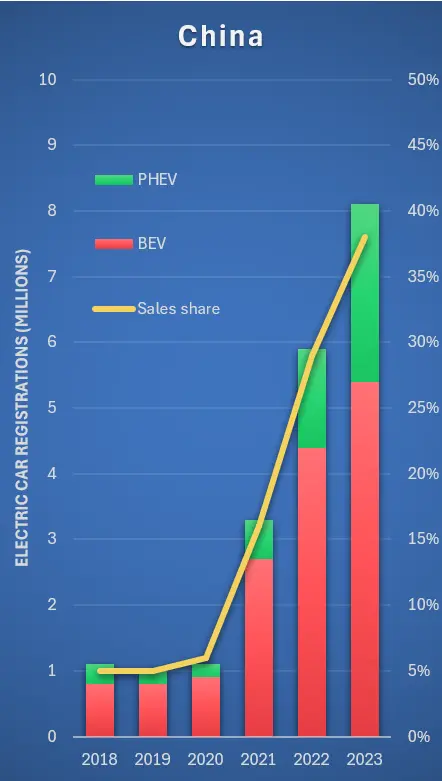
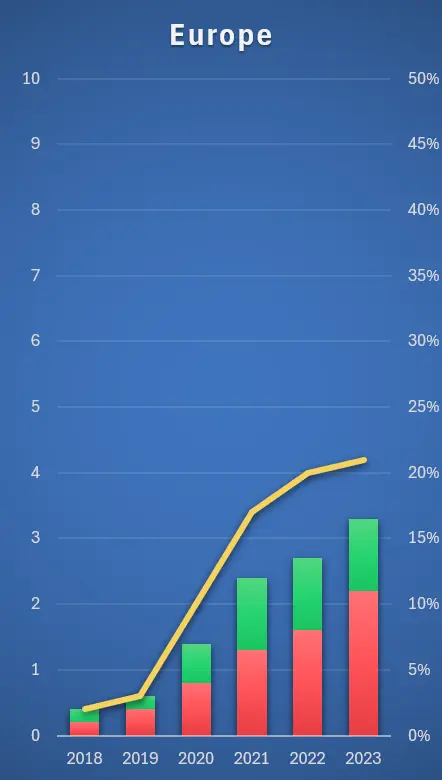
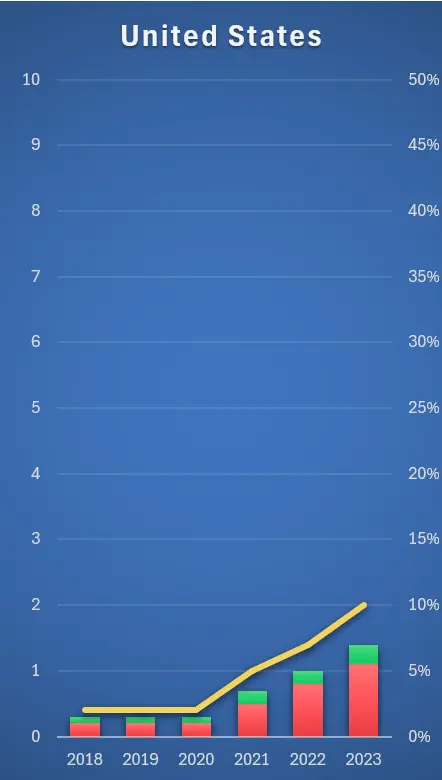
Electric vehicle sales continue to expand share globally, led by China
Electric car sales exceeded 17 million globally in 2024, taking their share of total car sales past 20%.
- The additional 3.5 million electric cars sold in 2024, compared with 2023, exceeds the total number sold worldwide in 2020
- China maintained its lead, with electric cars accounting for almost half of all car sales in the country in 2024
- Global electric car sales are expected to exceed 20 million in 2025, representing more than a quarter of cars sold worldwide
- Under today’s policy settings, the share of electric cars in overall car sales is set to exceed 40% by 2030
The pace of adoption means any business planning fleet, retail or infrastructure strategy around a slow EV transition is planning against the evidence, not with it.
Source: IEA (2025), Global EV Outlook 2025.
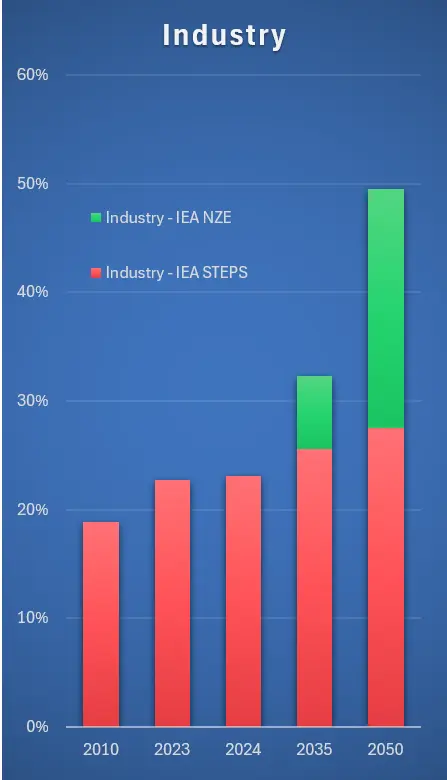
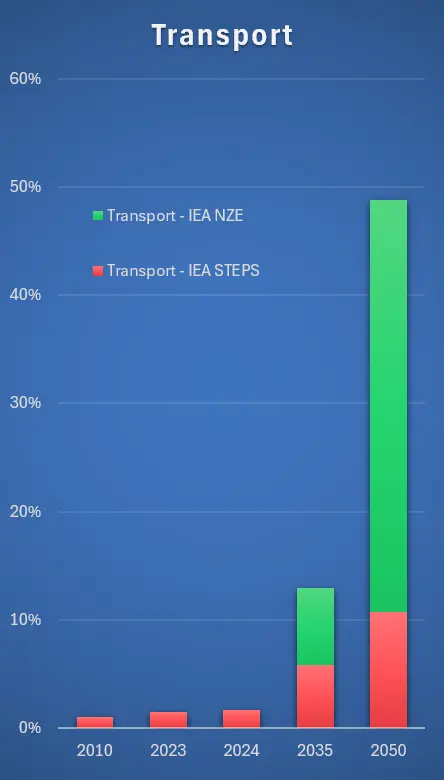
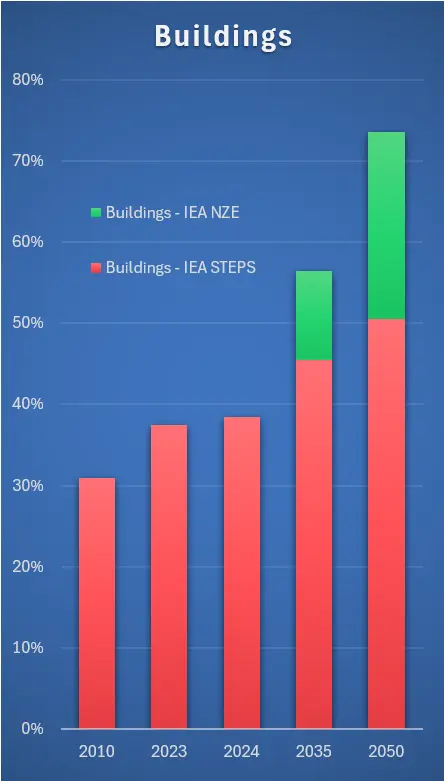
The level of electrification required varies substantially across IEA scenarios
The electricity share of total final energy consumption has been rising across the board, as industry, transport and buildings electrify alongside the greening of the grid.
- The uplift required to align with the IEA’s Stated Policies Scenario looks broadly achievable given current technology and momentum
- The gap to the Net Zero by 2050 scenario is far wider, and would require significant further changes in both policy and adoption
Where storage and renewables are largely macro trends, how fast a company electrifies its own operations is, for many sectors, a choice – albeit one which requires commercial assessment.
Source: IEA (2025), World Energy Outlook 2025.
Non-energy indicators are hardest to move. And the biggest gaps.
Non-energy indicators lag furthest behind the transition pathway. Dietary change, deforestation and carbon capture all face significant shortfalls against what either the IEA STEPS or Net Zero scenario requires. Unlike energy indicators, where the direction of travel is broadly positive, progress here is slow, inconsistent, and in some cases barely measurable since the baseline was set.
Per capita meat consumption continues to grow globally, but at lower emissions intensity
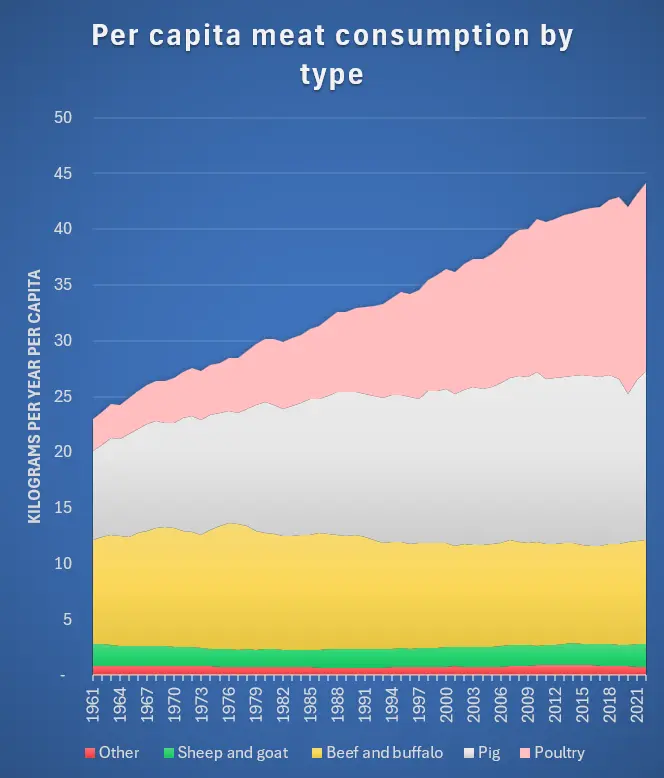
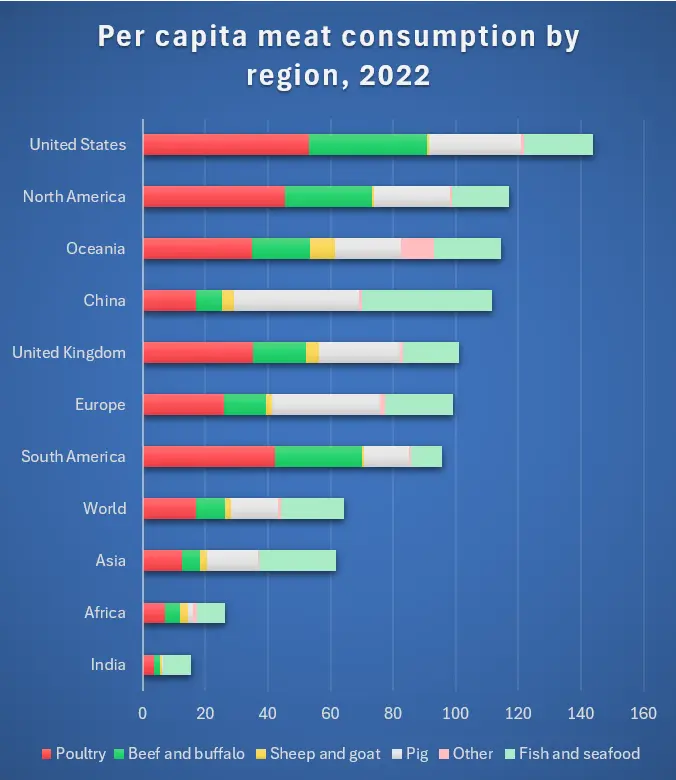
Global per capita meat consumption has grown 20% since 2000, but the mix has shifted toward lower-emissions poultry rather than beef.
- Per capita meat consumption has nearly doubled since 1961, driven by a marked rise in poultry consumption, from 11kg per person a year in 2000 to 17kg in 2022
- Beef consumption has stayed relatively flat globally, at around 10kg per person a year since 1961
- Beef is far more emissions-intensive than poultry: 71kg CO₂e per kg of beef, compared with 10kg CO₂e per kg of chicken
- Growth has been most marked in China, where consumption rose from 69kg per person in 2000 to 112kg in 2022, still below the US figure of 144kg per person a year
The composition of dietary change matters as much as the volume. A market shifting toward poultry over beef is moving in the right direction on emissions even while overall consumption keeps rising, a distinction most consumer-facing strategies still miss.
Source: Our World in Data (2024), Food and Agriculture Organization of the United Nations; Poore & Nemecek (2018), Reducing food’s environmental impacts through producers and consumers.
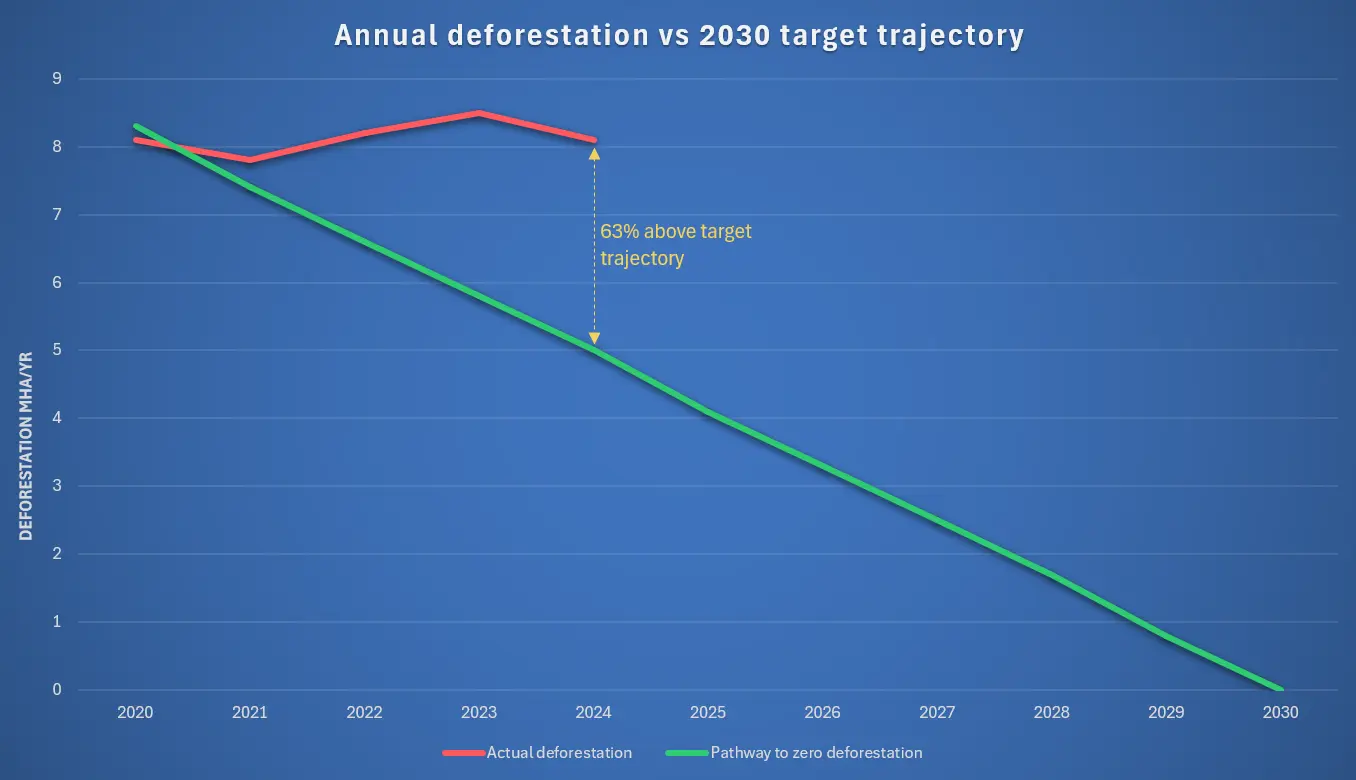
Lack of progress in annual deforestation rates means we’re now way off track
The 2024 global deforestation rate was 63% higher than the pace needed to reach zero deforestation by 2030.
- Reaching zero deforestation by 2030 requires a 10% annual reduction each year to 2030, rising to a 20% reduction each year from 2025
- The 2024 rate was only 2% below the 2018–2020 baseline, meaning almost no progress has been made in the four years since that baseline was set
- Tracked against a baseline average deforestation rate from 2018–2020
Of all fourteen indicators in the index, this is the one furthest off track. Any business with deforestation exposure in its supply chain, directly or through commodities like beef, soy or palm oil, is exposed to a trend moving the wrong way, not a stalled one.
Source: WRI (2025), Deforestation and Restoration Targets Tracker.
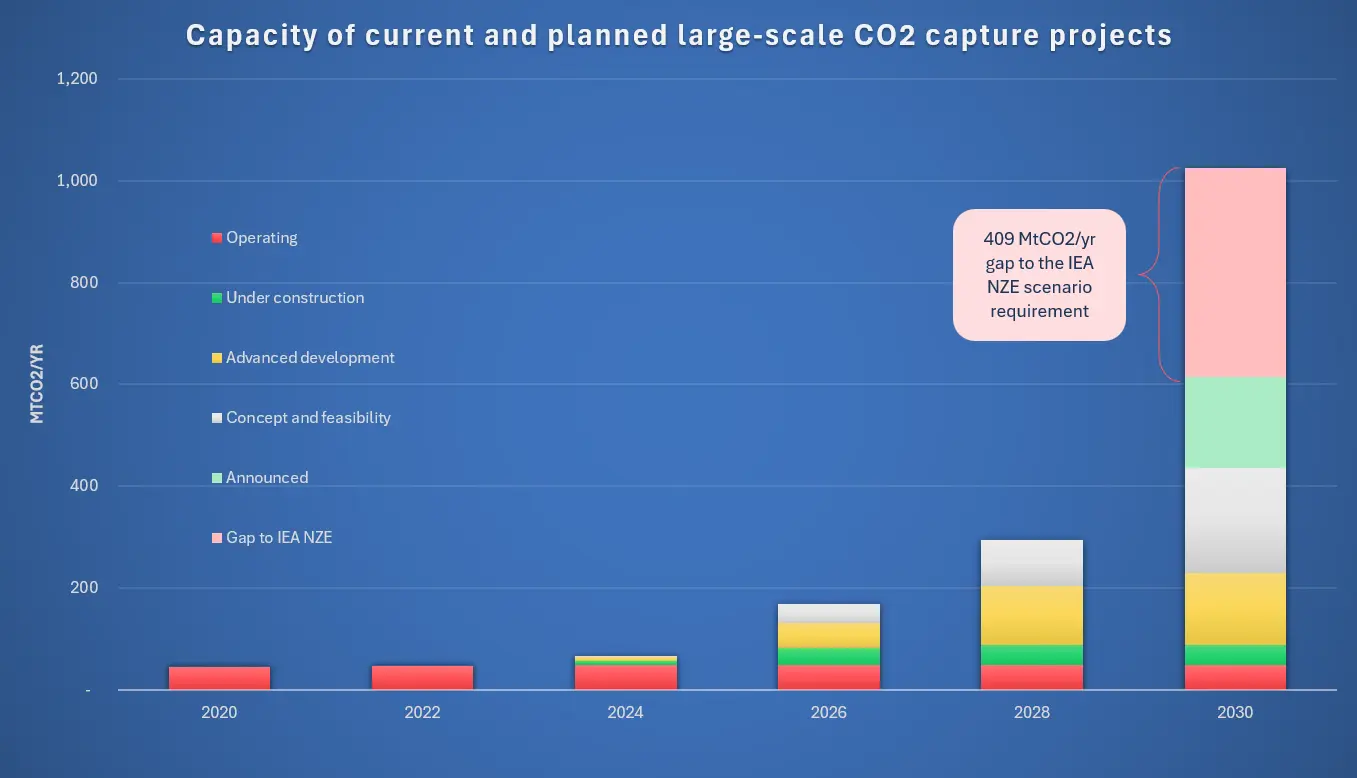
Carbon capture and storage deployment is gaining momentum, but a substantial gap to 2030 remains
Announced carbon capture and storage projects would deliver around 615 million tonnes of CO₂ captured per year by 2030, still around 40% short of the roughly 1 billion tonnes required under the IEA’s Net Zero scenario.
- Over 700 CCUS projects are now in various stages of development, according to the IEA, after years of underdelivery against expectations
- Committed capacity alone, without announced storage additions, would deliver around 435 million tonnes of CO₂ captured per year by 2030
Momentum has genuinely improved, but the gap is still large enough that carbon capture can’t be treated as a guaranteed backstop for hard-to-abate emissions in any credible transition plan.
Source: IEA Energy Systems (2024), Carbon Capture Utilisation and Storage.
Business progress is real and measurable. But must accelerate.
Corporate commitment to the low-carbon transition has grown substantially. Transition Pathway Initiative (TPI) management quality scores are improving year on year, C-suite leaders are increasing sustainability investment, and decarbonisation has moved firmly into the realm of business strategy. The direction of travel is positive across all three measures, though the pace at company level must accelerate significantly to close the gap to net zero pathways.
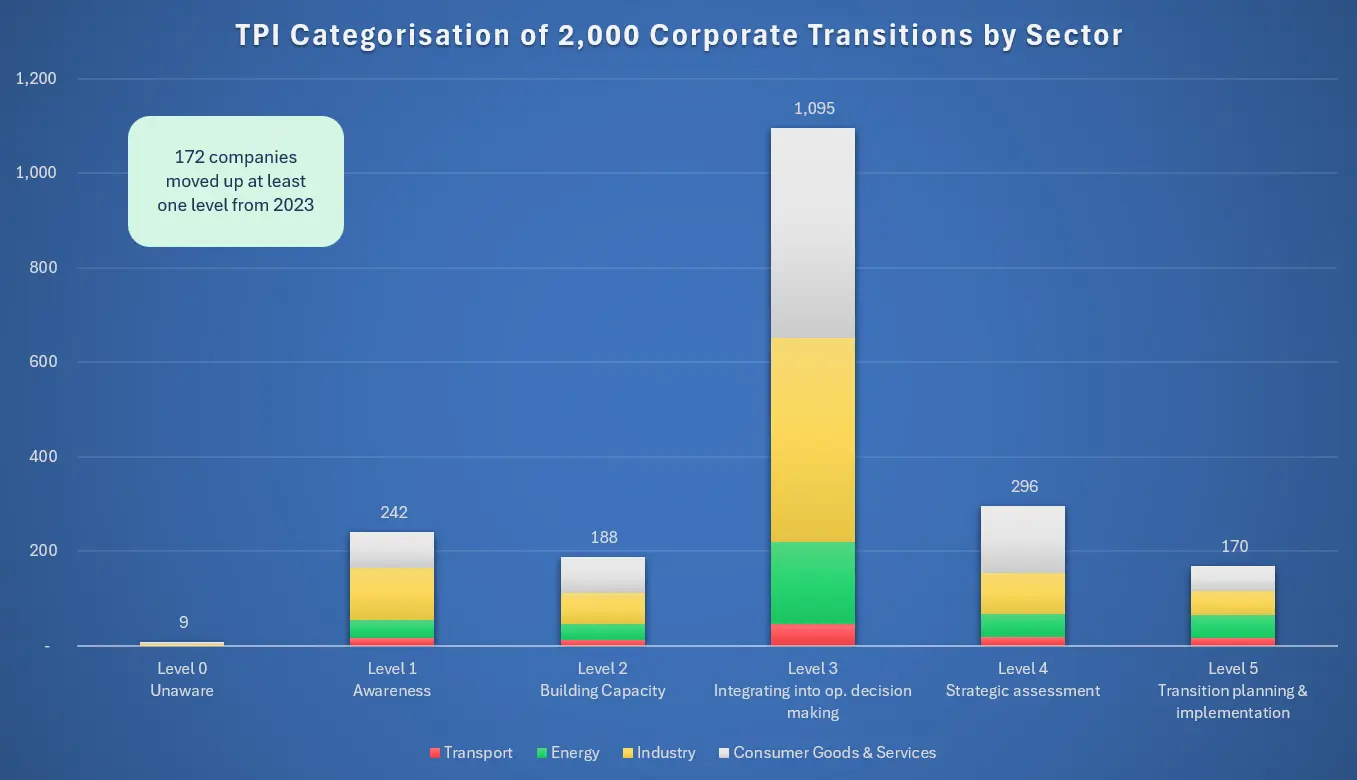
Companies continue to progress in their transition journeys
172 companies moved up at least one Transition Pathway Initiative (TPI) management quality level since 2023, continuing a multi-year trend of improvement.
- The TPI Management Quality framework assesses 2,000 companies’ carbon management and governance practices, on a scale from Level 0 (“Unaware”) to Level 5 (“Transition planning and implementation”)
- Level 3, where a company has a policy commitment to act, has set an emissions reduction target, and discloses Scope 1 and 2 emissions, remains the most common score
- Disclosure of material Scope 3 emissions rose from 36% of companies to 49%, and climate scenario planning rose from 52% to 64%
Scope 3 disclosure and scenario planning are the two areas moving fastest. For any board benchmarking its own transition planning against peers, these are now the metrics most likely to be used to judge it.
Source: TPI (2025), State of the Corporate Transition.
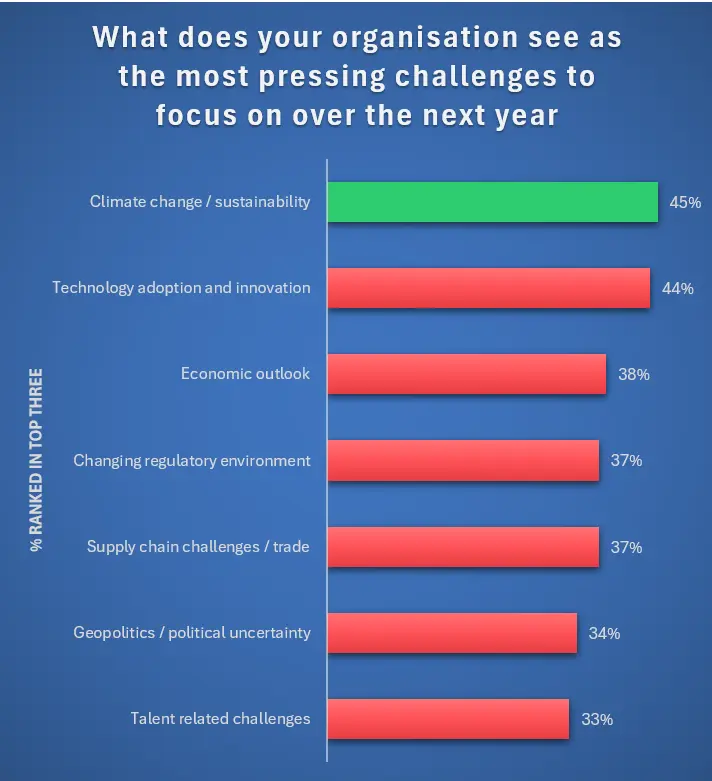
Sustainable investment remains a core priority for global executives
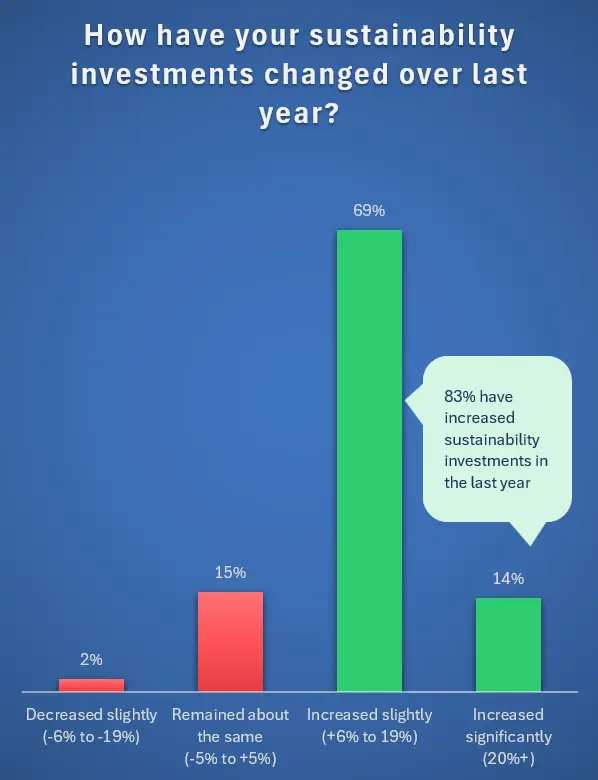
Sustainability remains a top three priority on the C-suite agenda globally, alongside technology adoption and artificial intelligence, according to Deloitte’s 2025 survey.
- Sustainability investment has increased over the past year, with revenue generation the most frequently reported business benefit
- Technology and AI are increasingly seen as key enablers, helping organisations turn sustainability effort into lasting business value
Sustainability has moved from a defensive, compliance-framed budget line to one judged on the same commercial terms as any other executive priority.
Source: Deloitte (2025), C-Suite Sustainability Report.
Decarbonisation has moved firmly into business strategy
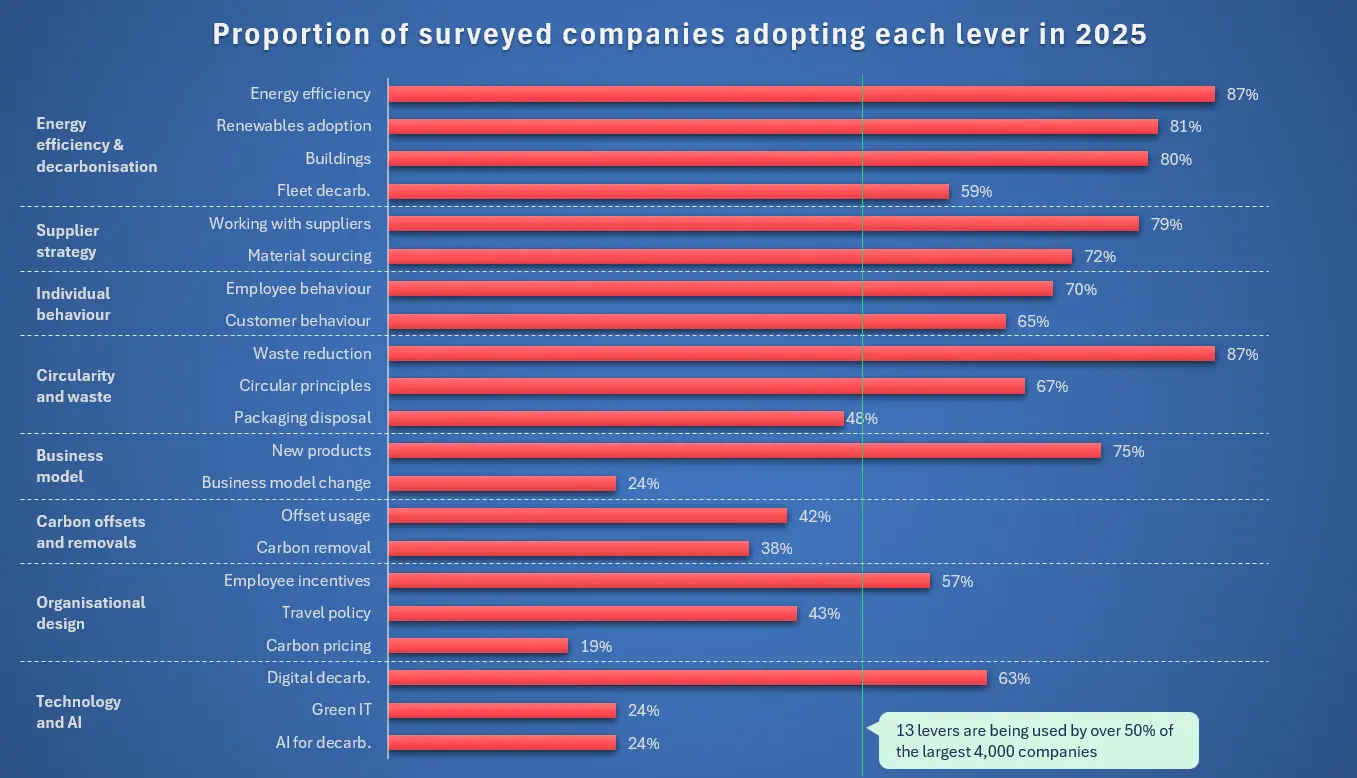
Nearly 90% of the world’s 4,000 largest companies now connect their decarbonisation efforts directly to business value, according to Accenture.
- For the largest companies, Accenture frames the live question as whether organisations are reinventing fast enough to capture the benefit of decarbonisation, not whether it delivers value at all
- Companies are using a widening range of decarbonisation levers, with energy efficiency, waste reduction, renewables adoption, building measures and supplier engagement the most commonly used
The debate at the largest companies has already moved past whether to decarbonise. The remaining strategic question, and the one boards should be pressure-testing, is whether the pace of reinvention matches the scale of the risks and opportunities.
Source: Accenture (2025), Destination Net Zero.
Perigon’s Low-Carbon Transition Index. 14 indicators, 2 pathways.
Across all 14 indicators, the transition scores 56.1 out of 100 against the pace required under the IEA’s Stated Policies Scenario, and 44.0 against the pace required for Net Zero, as of January 2026. Each indicator is scored 0–100 against both pathways. Scores combine direction of travel (40% weight) and pace relative to pathway requirements (60% weight). A score of 80+ is considered on track.
| Indicator | STEPS score | Net Zero score |
|---|---|---|
| Energy | ||
| Energy generation | 70 | 55 |
| Energy storage | 85 | 80 |
| Transport | 65 | 50 |
| Buildings | 72 | 58 |
| Industry | 60 | 44 |
| Energy intensity | 54 | 40 |
| Low-carbon fuels | 48 | 32 |
| Non-energy | ||
| Deforestation | 28 | 22 |
| Dietary change | 20 | 15 |
| Reforestation | 30 | 22 |
| Carbon capture | 48 | 35 |
| Enablers | ||
| Commitments | 78 | 70 |
| Investment | 72 | 55 |
| Carbon pricing | 55 | 38 |
80+ = on track · 60–79 = below required pace · below 60 = off track. Sub-scores inform composite scores where multiple data series apply. Source: Perigon Partners analysis, January 2026.
Primary sources and impartial review.
Perigon's Low-Carbon Transition Index (LCTI) is an independent, annual assessment of real-economy progress toward the low-carbon transition, built entirely from named primary sources.
Primary sources only
Data from IEA, IRENA, BloombergNEF, SBTi, Oxford Climate Policy Monitor, TPI, WRI and others.
Performance assessment
Each indicator is scored on annual trend (40% weighting) and performance relative to that required by the IEA STEPS and IEA Net Zero scenarios (60%).
Updated annually
Published each year with a consistent set of fourteen indicators, building a citable year-on-year dataset. First established in 2025.
No politics
The LCTI describes what the data shows. Perigon doesn’t advocate for specific policies. We report on what’s happening and what the gap is.